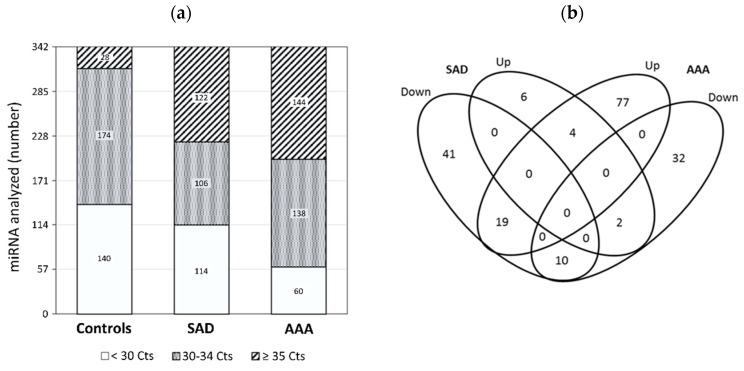
Figure 1.
Identification of miRs expression by PCR (polymerase chain reaction) array: (a) Distribution of Ct values of 342 miRs expressed in controls, in patients with subaneurysmal aortic dilations (SAD), and in patients with aneurysmal aortic dilations (AAA); (b) Venn diagram of miR analysis in patients with SAD and AAA. The miRs ≥ 2-fold differentially increased or decreased in comparison with controls are depicted in 4 overlapping ellipses. The numbers indicate the miR counts in the indicated area. miRNA, MicroRNAs.

