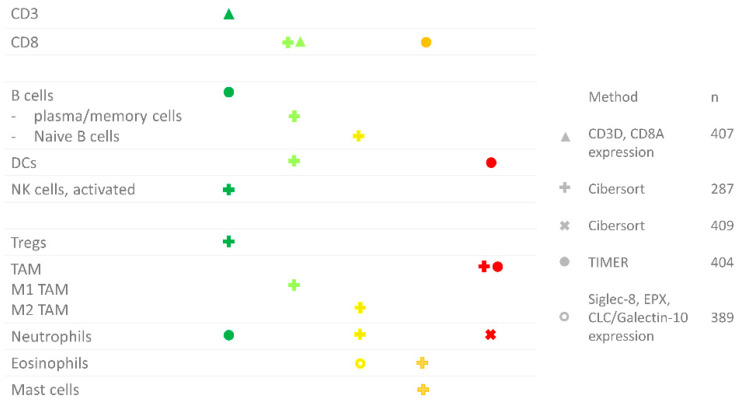
Figure 3.
Overview of RNA sequencing studies in bladder cancer per immune cell type. The color (and position) indicate whether there was a positive or negative correlation. Dark green: significant positive correlation; light green: trend towards a positive correlation; yellow: no trend; orange: trend towards a negative correlation; red: negative correlation. The shape indicates the study where the data was derived from: ∆ [13], + [24], x [51], ● [12], o [52].

