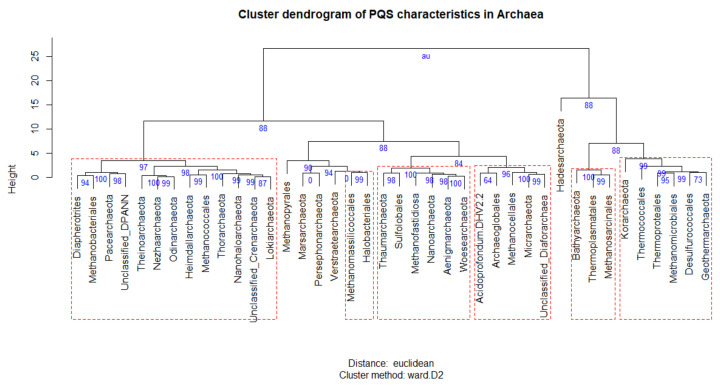
Figure 5.
Cluster dendrogram of PQS characteristics of archaeal subgroups. Cluster dendrogram of PQS characteristics (Supplementary Table S4) was made in R v. 3.6.3 (code provided in Supplementary Table S4) using pvclust package with these parameters: Cluster method ‘ward.D2′, distance ‘euclidean’, number of bootstrap resamplings was 10,000. AU values are in blue and indicate the statistical significance of particular branching (values above 95 are equivalent to p-values lesser than 0.05). Statistically significant clusters are highlighted by red dashed rectangles.

