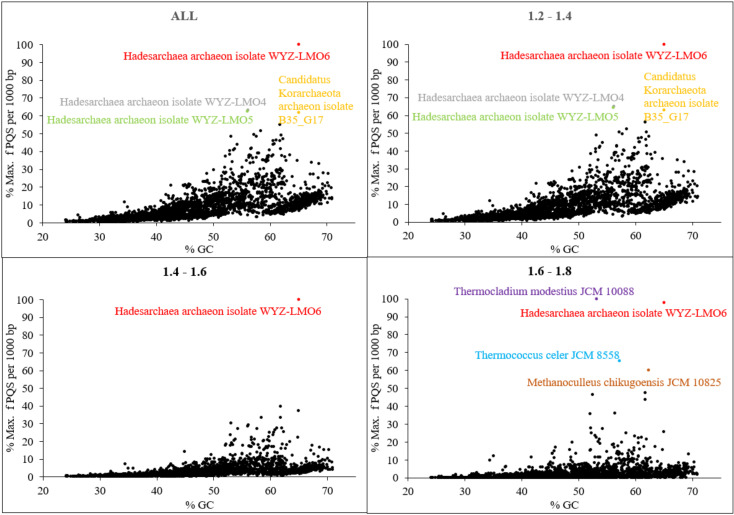
Figure 6.
Relationship between the observed frequency of PQS per 1000 bp and GC content. Different G4Hunter score intervals are considered. In each G4Hunter score interval miniplot, frequencies were normalized according to the highest observed frequency of PQS. Organisms with max. frequency per 1000 bp greater than 50% are described and highlighted in color.

