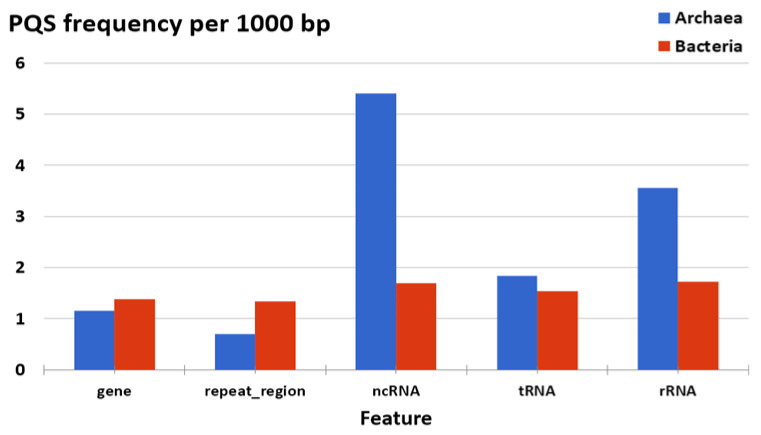
Figure 8.
Differences in PQS frequency by DNA locus. The chart shows PQS frequencies normalized per 1000 bp annotated locations from the NCBI database and shows a comparison between Archaea and Bacteria. Archaea G4-prone motifs are strongly over-represented in ncRNA and rRNA compared to the average G4 density in Archaea (mean f = 1.207), but also compared to bacteria. PQS count is provided in Supplementary Table S3 Excel file.

