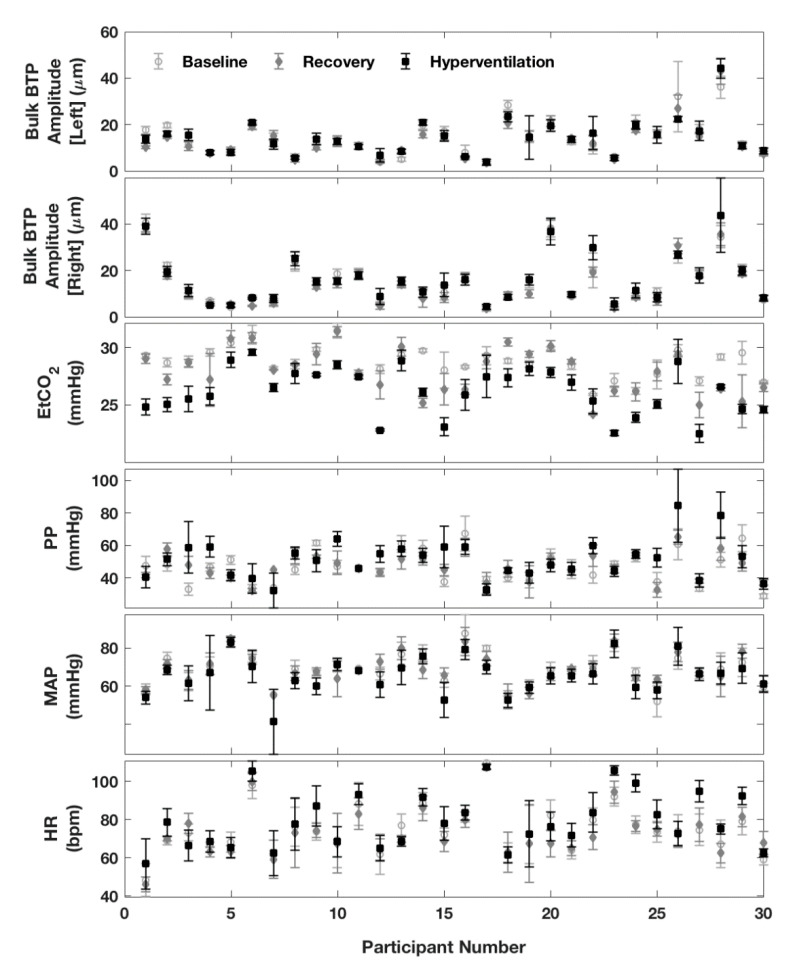
Figure 4.
Summary of changes in variables between baseline, hyperventilation, and recovery for each participant. Graphs for Left and Right Bulk BTP Amplitude show the mean beat-to-beat value calculated over a 30 s interval, with the standard deviation (SD) indicated by error bars. Graphs for the remaining variables (EtCO2, PP, MAP, and HR) show the median beat-to-beat value with the IQR indicated by error bars.

