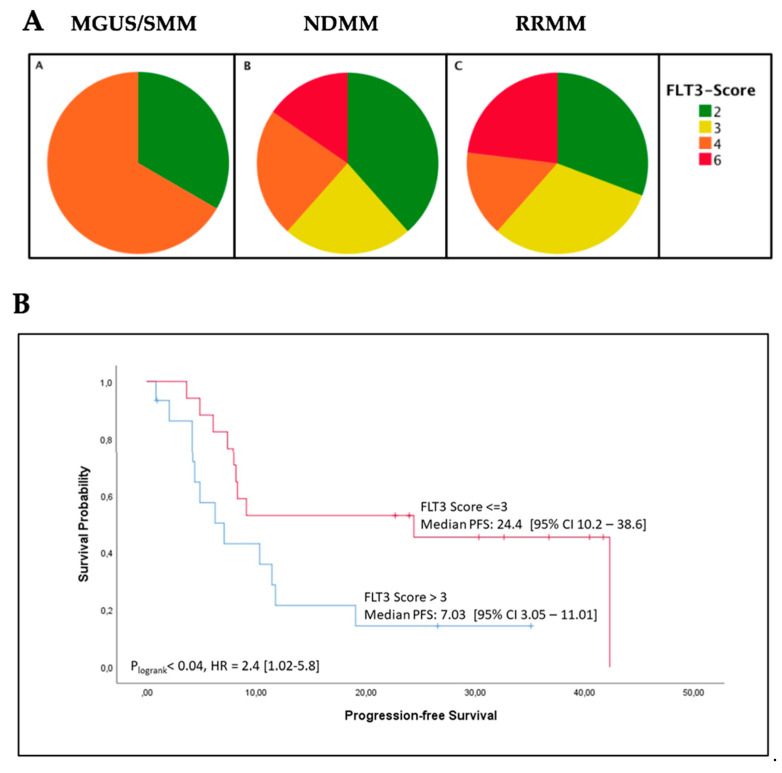
Figure 3.
(A) Distribution of FLT3 expression immunohistochemistry score (FES) values within the MGUS/SMM (A, n = 3), NDMM (B, n = 26), and RRMM (C, n = 13) patients. The FLT3 expression did not differ significantly between the three patient groups according to the semi-quantitative FLT3 IHC expression score (FES, range 2–6). (B) The progression-free survival (PFS) (in months) of MM patients with high FLT3 expression (FES > 3; n = 15) was significantly shorter in comparison to patients with low FLT3 expression (FES ≤ 3; n = 17); p = 0.04, HR = 2.4.

