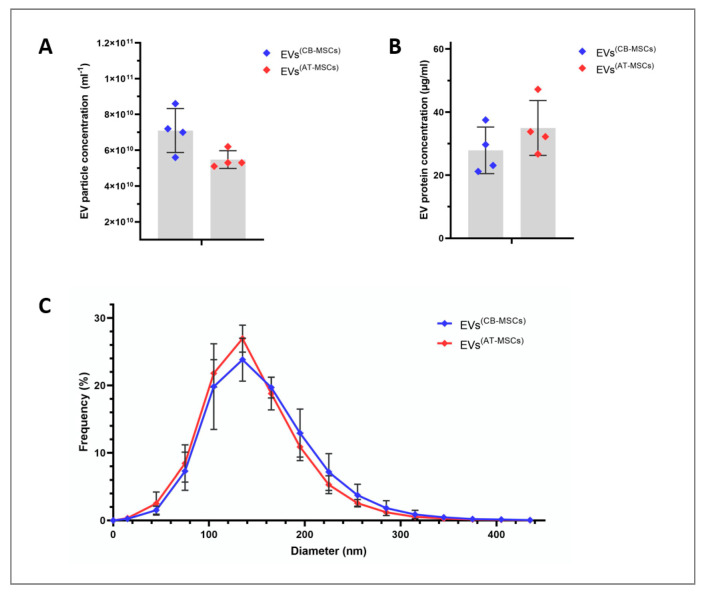
Figure 2.
Particle number, protein amount and size distribution of EVs isolated from CB- and AT-MSCs. Particle concentration (A) and size distribution (C) of EV preparations were measured by nanoparticle tracking analysis. Protein content (B) was determined by the bicinchoninic acid assay. In (A–C), the results are mean values ± standard deviation (SD) obtained from four different donors per cell type.

