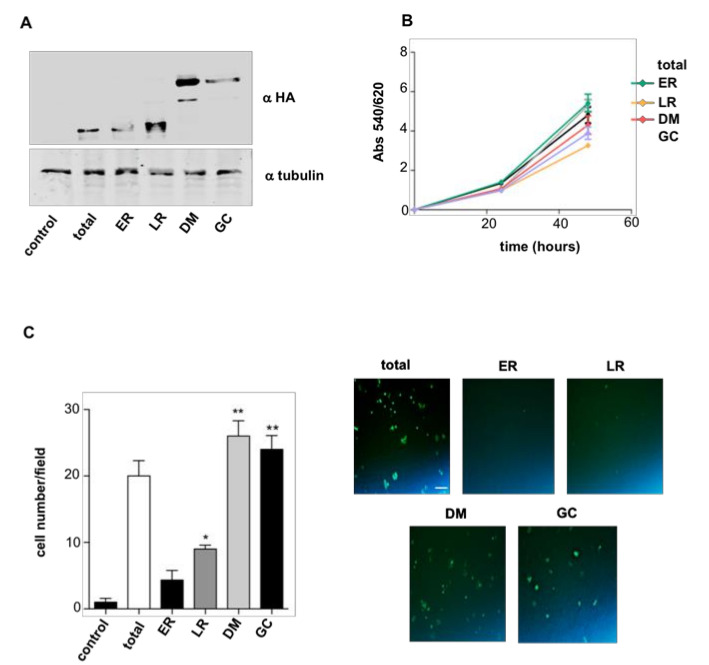
Figure 1.
HRAS site-specific effects on cellular proliferation and migration. (A) Expression levels of the targeted RAS proteins in stably transfected PCCL3 as determined by anti-HA immunoblotting. Cells were transfected with empty vector (control); HRASV12 (total); M1-HRASV12 (endoplasmic reticulum (ER)); LCK-HRASV12 (LR); CD8-HRASV12 (disordered membrane (DM)); and KDELr-HRASV12 (Golgi complex (GC)). (B) Cellular proliferation rate of the aforementioned cell lines. (C) Transwell migration assay for the aforementioned cell lines. Left panel: data show mean ± SD of cells per field of three independent experiments. * p < 0.05, ** p < 0.01 by two- tailed unpaired Student t-test. Right panel: Caption of migrated cells through 8 μm pore transwell after 24 h. Scale bar = 50 μm.

