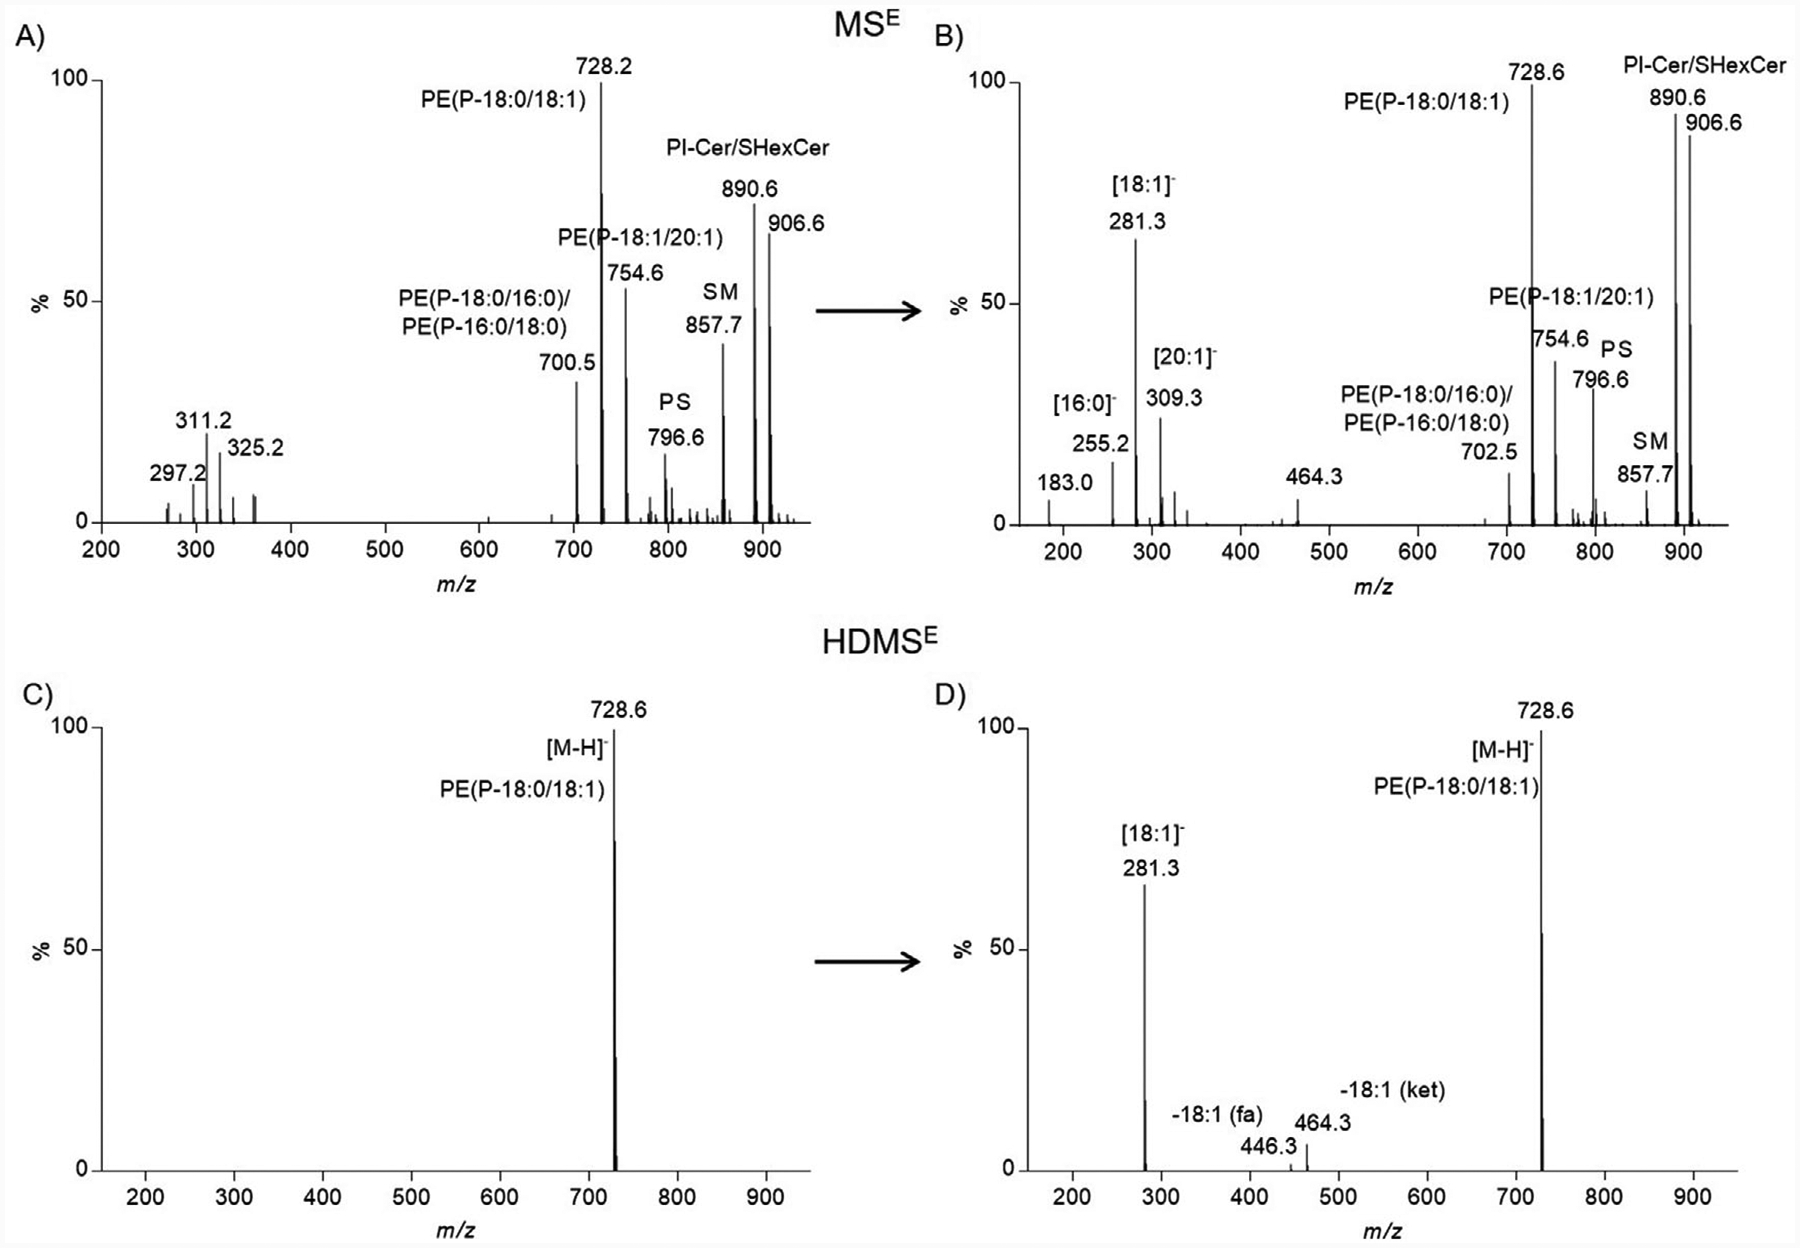
Figure 2.

Spectral complexity of MSE vs. HDMSE. A) Negative ion mode mass spectrum corresponding to the low collision energy scan (MSE) for PE(P-36:1) (m/z value, 728.5641; tR, 14.2 min). Several other precursor ions co-eluted at this retention time and are present in the mass spectrum. B) Negative ion mode tandem mass spectrum corresponding to the elevated collision energy scan (MSE) for PE(P-36:1) (m/z value, 728.5641; tR, 14.2 min). Product ions observed could not confidently be assigned to specific precursor ions. C) Negative ion mode mass spectrum corresponding to the low collision energy scan (HDMSE) for PE(P-36:1) (m/z value, 728.5641; tR, 14.2 min; drift time bin threshold <2%). Only one precursor ion is observed with traveling wave ion mobility enabled. D) Negative ion mode tandem mass spectrum corresponding to the elevated collision energy scan (HDMSE) for PE(P-36:1) (m/z value, 728.5641; tR, 14.2 min; drift time bin threshold <2%). Product ions observed were assigned to a single precursor ion.
