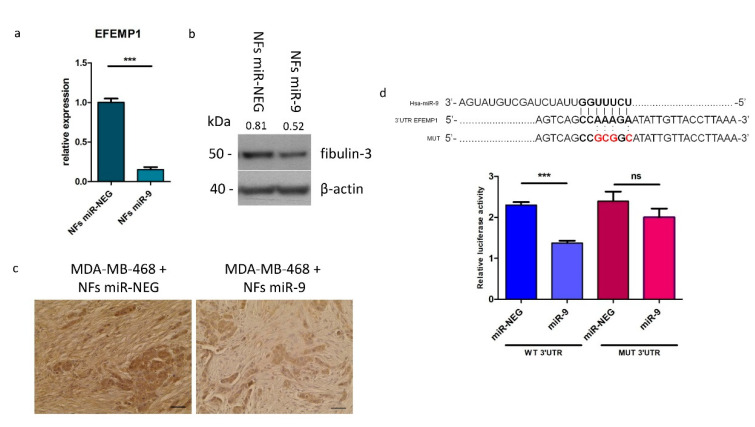
Figure 2.
EFEMP1 is a direct target of miR-9. Evaluation of EFEMP1 gene and protein levels by qRT-PCR (a), western blot (b) and IHC (c). qRT-PCR and western blot analysis were performed on NFs miR-9 vs. control. Protein expression levels are indicated above western blot bands. IHC images show fibulin-3 expression in ex vivo samples of tumors grown from the co-injection of MDA-MB-468 cells and NFs miR-NEG/9. Images are representative; the experiment was performed on 6 tumors per group. Scale bars 2.5 μm (d). Luciferase assay performed on HEK293 cell line transfected with miR-9 or control and with wild-type or mutated EFEMP1 3′UTR (mutated sequence shown above). Data are presented as the mean of three biological replicates ±SEM (*** p < 0.001, ns = non-significant).

