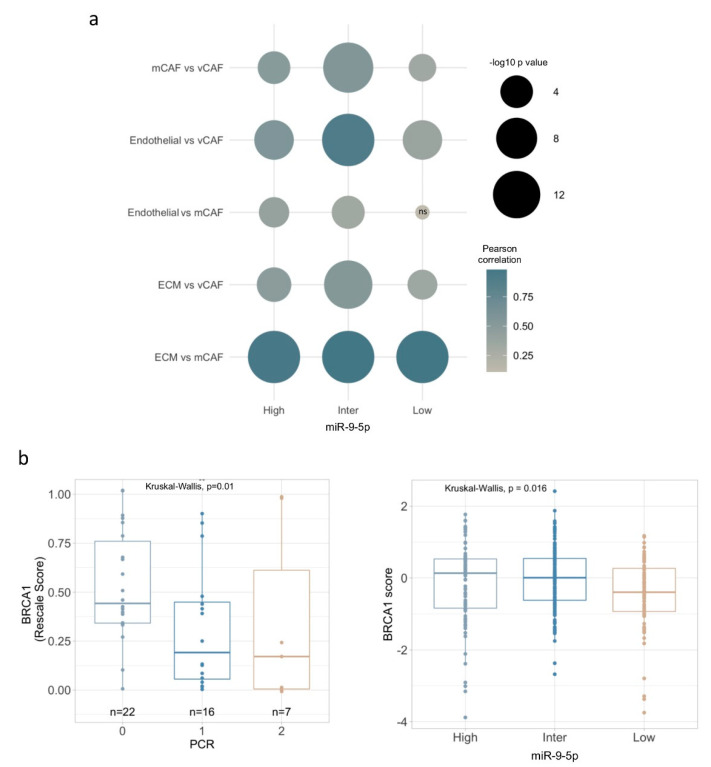
Figure 5.
miR-9 expression in TNBC correlates with different CAF subsets and resistance to cisplatin. (a) Bubble plot showing computed Pearson correlations between TNBC subgroups according to miR-9 expression, CAF subsets and biological signatures of related functions. ns: non-significant, significant p value < 0.05. Bubble colour represents Person correlation, while size corresponds to −log10 p value, as illustrated in plot legend. (b) BRCA1 gene expression in two well-characterized cohorts of patients with TNBC treated in neoadjuvance with cisplatin (GSE18864 and GSE103668), evaluated Pathological complete response by Miller-Payne (MP) criteria (0: MP 0, 1, 2 Progression, no change or still high tumor cellularity; 1: MP 3, 4 minor and marked loss of tumor cells, 2: MP 5 non-malignant cells) (left panel), and BRCA1 gene expression in TNBC sub-grouped by miR-9 expression (right panel).

