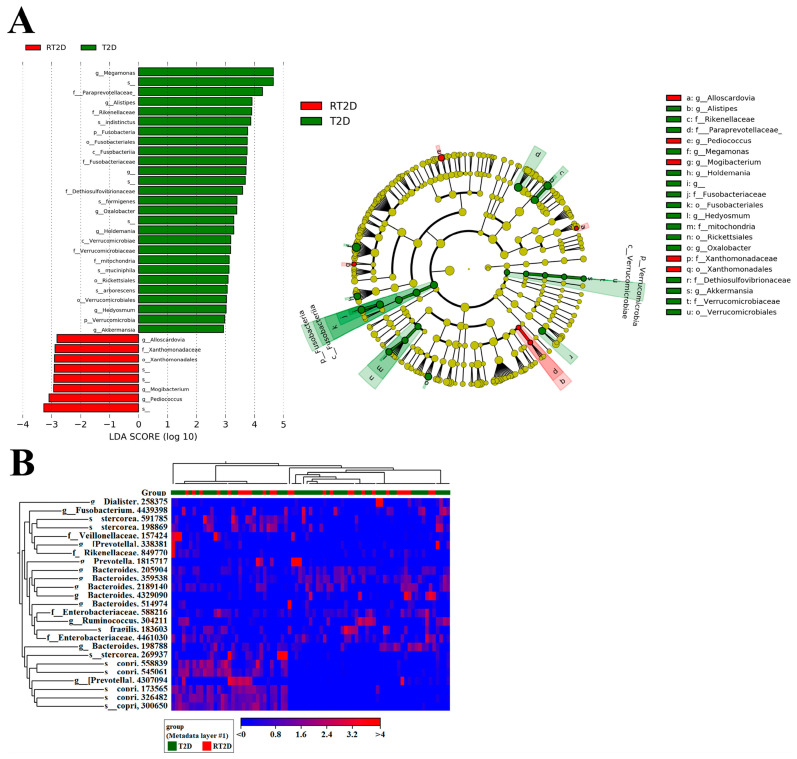
Figure 3.
Microbial markers that distinguish between T2D and RT2D. (A) linear discriminant analysis effect size (LEfSe) analysis revealed that Verrucomicrobia, A. muciniphila and Fusobacteria were more abundant in T2D patients. (B) Heatmap analysis representing relatively high (red) and low (blue) abundances of specific microbial constituents in fecal samples from T2D and RT2D patients.

