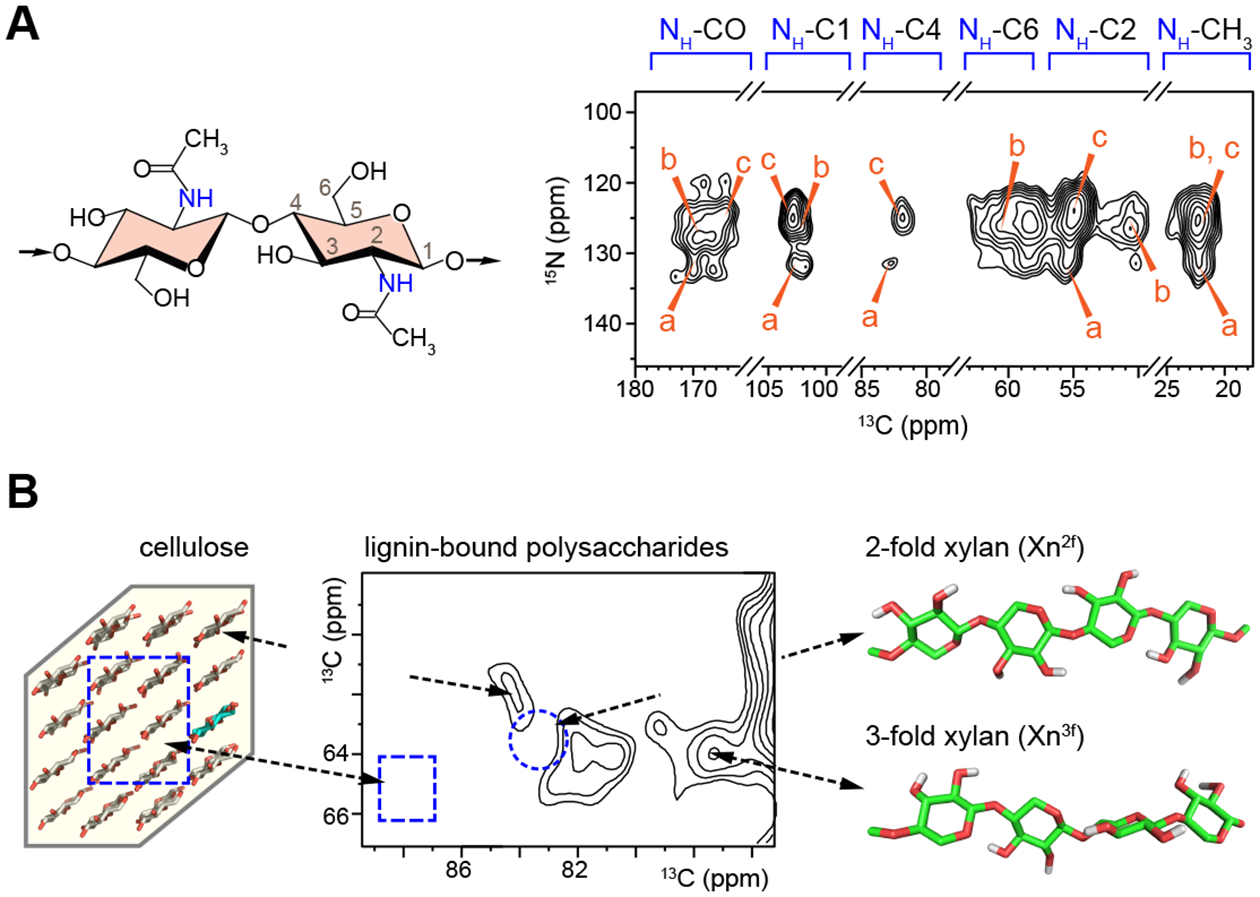
Figure 4. Polysaccharide structure and polymer binding in plant and fungal cell walls.

(A) Representative structure and MAS-DNP spectra of chitin in cell walls of intact A. fumigatus. Three major types of chitin signals have been resolved (Types a-c). (B) The aromatic-edited spectrum of maize stems shows the signals of lignin-bound carbohydrates. Arrows and black dotted lines connect the spectral regions with polysaccharide structures. The dashline circle and rectangle on the spectrum highlight the missing signals of the carbohydrate components that are far from lignin. Figures are adapted from references [10, 11], which are open-access publications.
