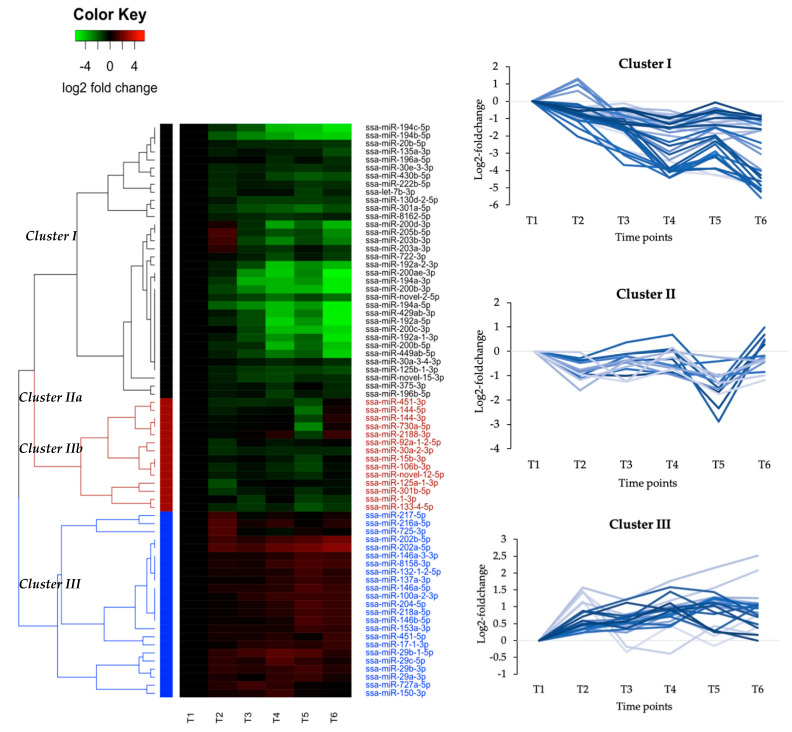
Figure 1.
Heatmap of differentially expressed (DE) miRNAs generated by hierarchical clustering. All expression at T2–T6 is relative to T1 (pre-smolt, one day before smoltification). T2–T4 are relative expression during light treatment period/smoltification while T5–T6 are relative expression in the post SWT period. Expression at each time point (columns) is based on independent small RNA sequencing of 8 samples. Each row in the heatmap represents the relative expression of the mature miRNA annotated to the right for the row. The magnitude and direction of expression changes illustrated by color is given by the color key above the heatmap. Each of the three major clusters is denoted by color codes on the left side of the heatmap (Cluster I-black, Cluster II-red, Cluster III-blue). On the right side of the heatmap, additional plots illustrate the expression profiles of each cluster. The relative log2 foldchange compared to T1 is illustrated for other time points. Graphs highlighted in dark blue indicate most typical expression profile of each cluster while graphs highlighted in light blue correspond to less characteristic expression profiles.

