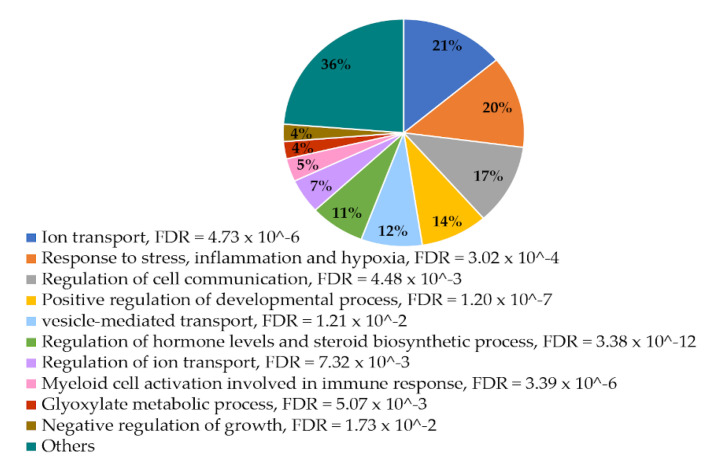
Figure 2.
Distribution of largest groups sharing significantly enriched biological processes among the negatively correlated DE genes. Proportions are estimated from total number of negatively correlated genes for each gene ontology (GO) group, but as several genes belong to more than one group, the sum is more than 100%.

