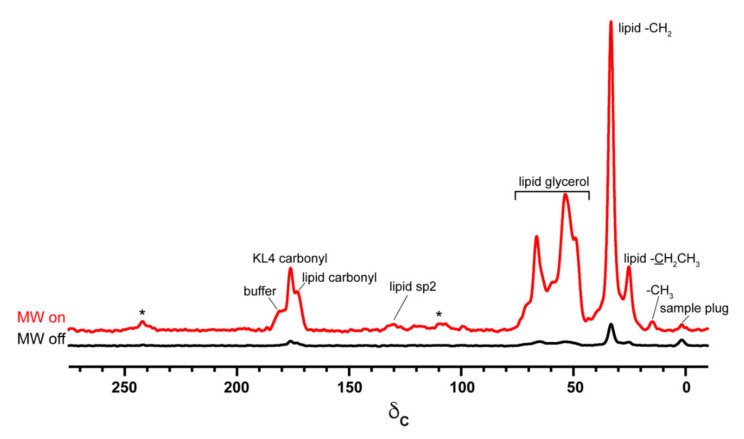
Figure 6.
13C chemical shift spectra collected with MW off (black) or microwave on (red) for a sample containing 5.5/2.7/2/1 DPPC-d62/DPPC/POPG/cholesterol MLVs with 2 mol% K4 equilibrated in a buffer containing 10% DMSO-d6 and 10 mM AMUPol. Spectra were scaled based on the number of transients averaged. The “MW on” spectrum is an average of 32 transients collected in ~2 min; the “MW off” spectrum is an average of 512 transients collected in ~35 min. MAS sidebands are indicated by an *. Since the DMSO is deuterated, solvent resonances contribute minimally to the spectrum.

