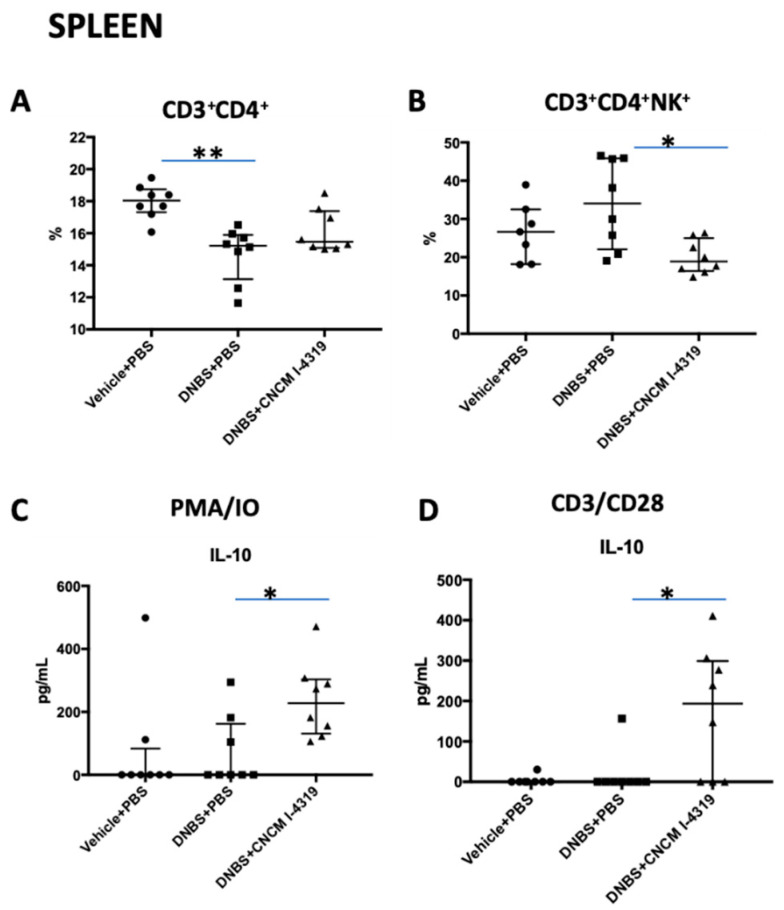
Figure 7.
Splenocyte population levels in LGI model. CD3/CD4-positive cells and subsets detected by flow cytometry (A,B) and cytokine production in splenocyte cultures stimulated with CD3+/CD28+ or PMA/IO (C,D). Control non-inflamed (vehicle-PBS), control inflamed (DNBS-PBS), B. bifidum CNCM I-4319 strain (DNBS-CNCM-I4319). *: p < 0.05, **: p < 0.01.

