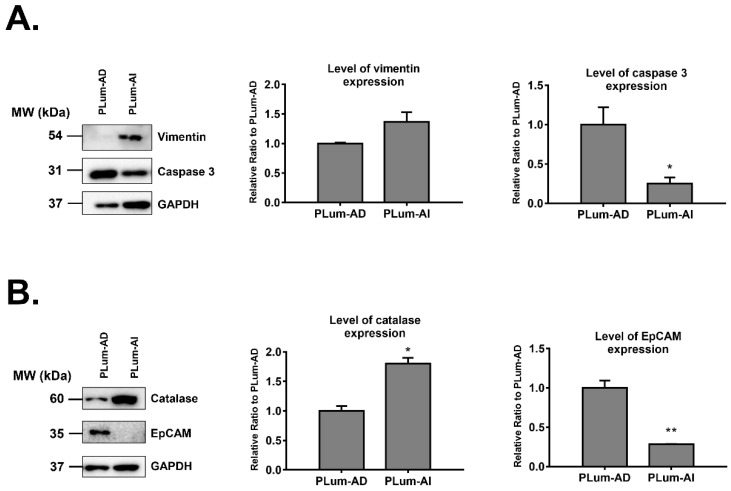
Figure 3.
Western blot validation of four proteins identified by mass spectrometry to be differentially expressed in PLum-AI relative to PLum-AD cells (n = 3). (A) Western blot validation of vimentin and caspase 3 proteins. (B) Western blot validation of catalase and EpCAM proteins. Bands were detected by enhanced chemiluminescence (ECL) using the ChemiDoc MP Imaging System. Protein expression was quantified using Image Lab software, relative to the expression of glyceraldehyde 3-phosphate dehydrogenase (GAPDH), a housekeeping gene equally expressed in treated and non-treated cells/spheres. Results are expressed as relative ratio to control. Data represent an average of three independent experiments. The data are reported as mean ± SEM. (* p < 0.05, ** p < 0.01; PLum-AI cells compared to PLum-AD cells, student independent t-test).

