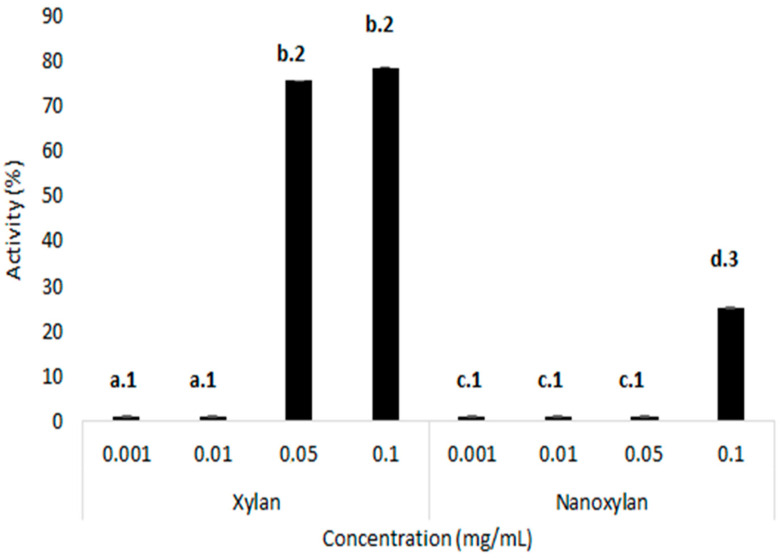
Figure 9.
Iron-chelating activity of xylan and nanoxylan. Different letters (a, b, c, and d) represent statistically significant differences between the same concentration of xylan and nanoxylan. Different numbers (1, 2, and 3) represent statistically significant differences between different concentrations (0.001; 0.01; 0.5; 0.1 mg/mL) of xylan and nanoxylan (0.001; 0.01; 0.05; 0.1 mg/mL). p < 0.01.

