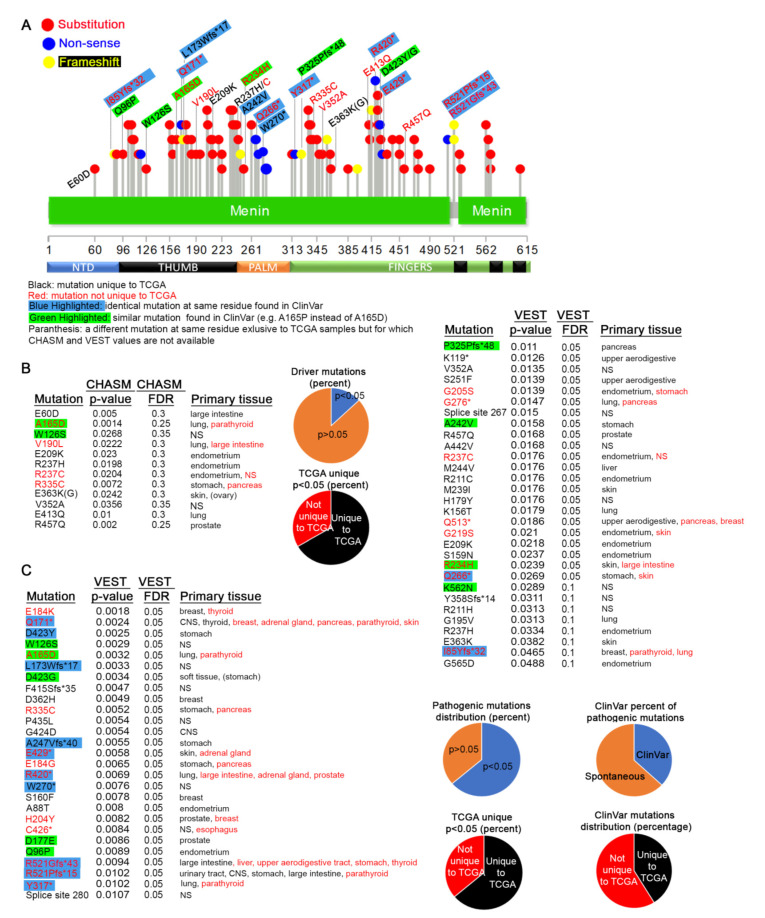
Figure 6.
MEN1 mutations in primary cancers. (A) Distribution of all germline mutations that appear in TCGA samples of primary cancer sites. The legend explaining the color-coding scheme is shown below the diagram. ClinVar does not give the exact frameshift mutation, but, if a frameshift is indicated at the same residue, we assumed it to be identical. (B,C) CHASM, VEST p-values, and tissue distribution for the mutations shown in (A). The same color-coding scheme as in (A) is observed. Pie charts summarize the data in the tables.

