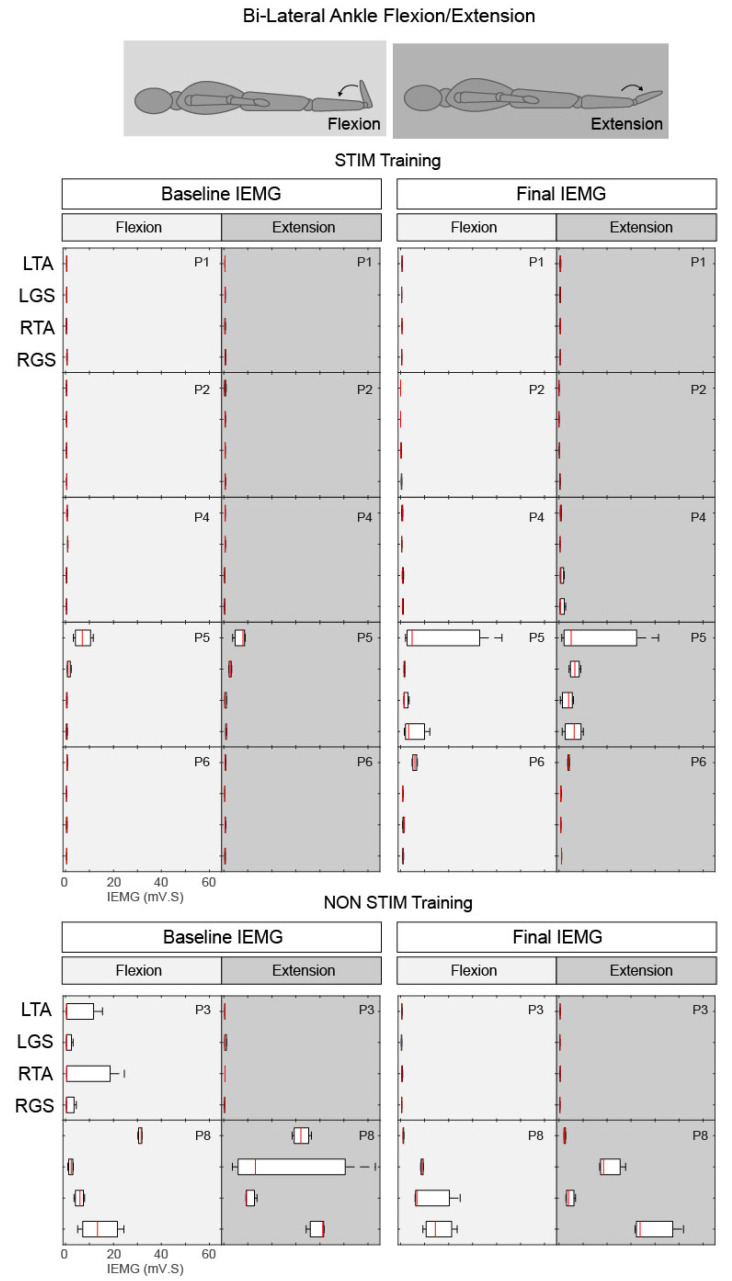
Figure 6.
Box plots of integrated EMG activity recorded from the left (L) and right (R) Tibialis Anterior (TA) and Gastrocnemius (GS) during ankle flexion (light grey) and extension (dark grey) movements without tSCS, before (Baseline) and after (Final) the intervention for all participants. Patterns of IEMG (averaged over 3 trials) are displayed for each participant during both flexion and extension phases. Each plot indicates the 25–75th percentiles (box), minimum and maximum values (whiskers), and median value (central red line).

