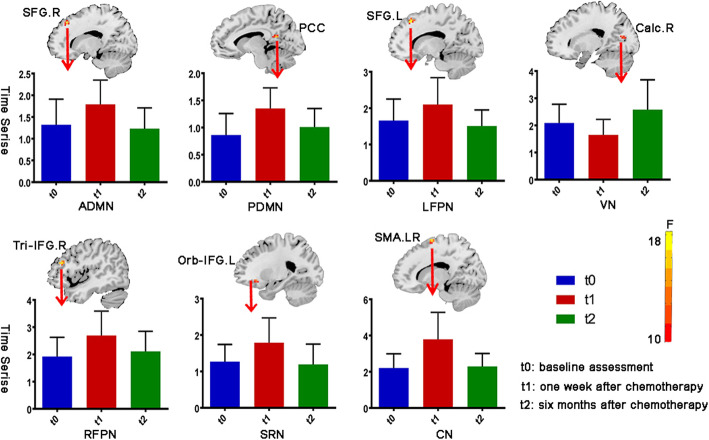
Fig. 2.
Seven RSNs show significant within-network connectivity changes in breast cancer patients among three time points. The histograms display the longitudinal evaluation of the within-network functional connectivity changes in the peak cluster regions for each RSN at three time points. t0, baseline assessment; t1, one week after chemotherapy; t2, six months after chemotherapy. SFG. R, right superior frontal gyrus, PCC, posterior cingulate gyrus, SFG. L, left superior frontal gyrus, Tri-IFG.R, Pars triangularis of right inferior frontal gyrus, SMA. R, right supplementary motor area, Orb-IFG.L, Left orbital inferior frontal gyrus, Calc. R, right calcarine sulcus cortex

