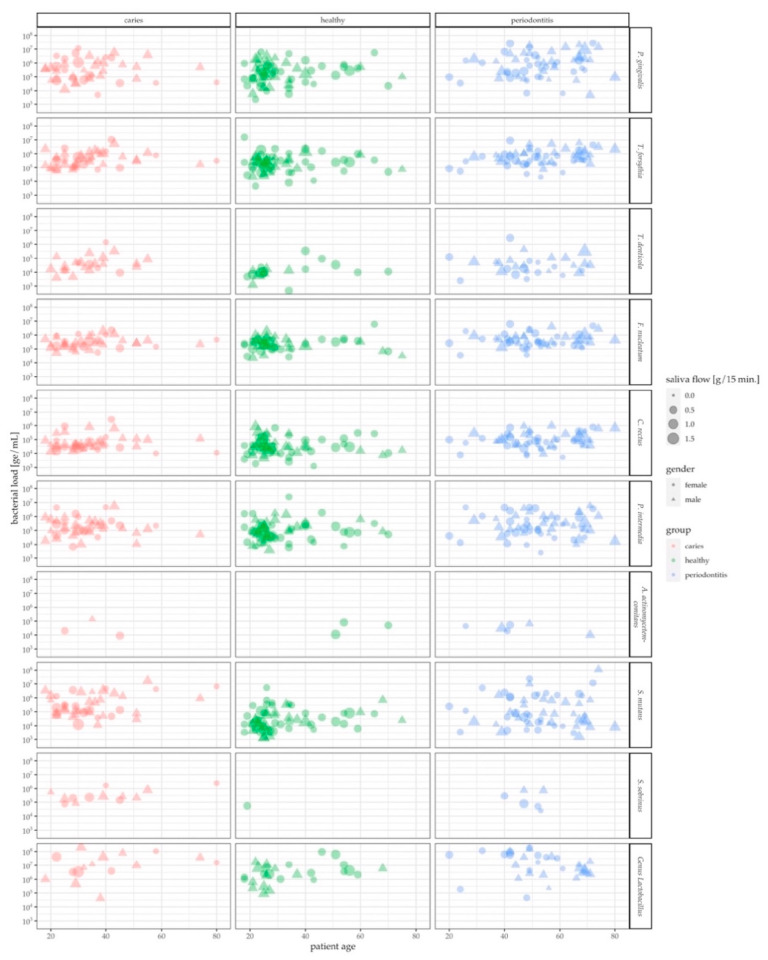
Figure 3.
Overview of the age, gender and saliva flow rate distribution. Depending on their classification, data from caries patients are displayed in red (left), healthy individuals in green (middle) and periodontitis patients in blue (right). The bacterial loads in genome equivalents (ge/mL) are presented for all analyzed bacterial strains, captioned for each strain on the right.

