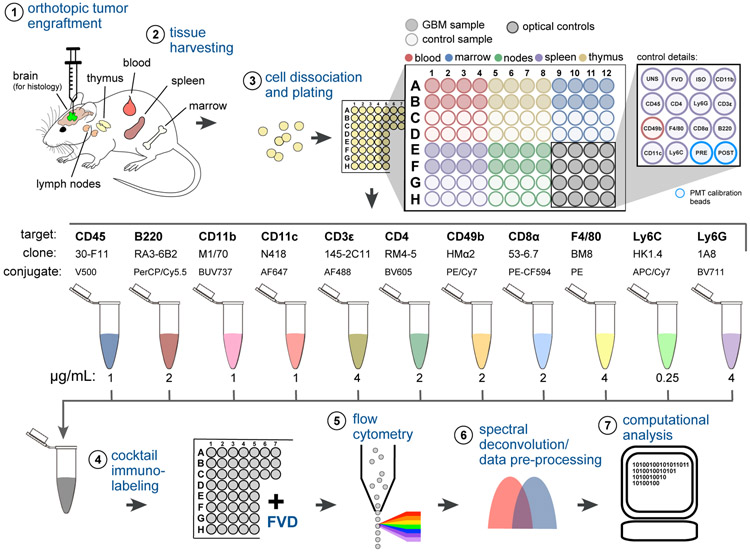
Figure 1. Immunoprofiling GBM-Bearing Mice by 12-Color Flow Cytometry.
(1) GBM cells (or vehicle control) were stereotactically engrafted into the brain striata of age-matched mice.
(2) Lymphoid tissues were harvested from 8 replicate mice of GBM injected or control mice 7, 14, or 30 days after tumor engraftment.
(3) Tissues were disaggregated and plated in a 96-well V-bottom plate. Plate locations for wells corresponding to unstained splenocytes (UNS), fixable viability dye (FVD), CD45 isotype control (ISO), single-color compensation controls (target names), and PMT calibration beads run before and after data acquisition (PRE, POST) are indicated.
(4) Cells were immunolabeled with 11 fluorophore-conjugated antibodies and then stained with FVD.
(5) Single-cell data were acquired by high-throughput flow cytometry.
(6) Raw data were spectrally deconvolved and viable single-cells were selected for analysis.
(7) Preprocessed data underwent a histogram gating procedure (as described in Figure 3) prior to computational analysis using SYLARAS software. See also Figures S1-S3; Table S1.

