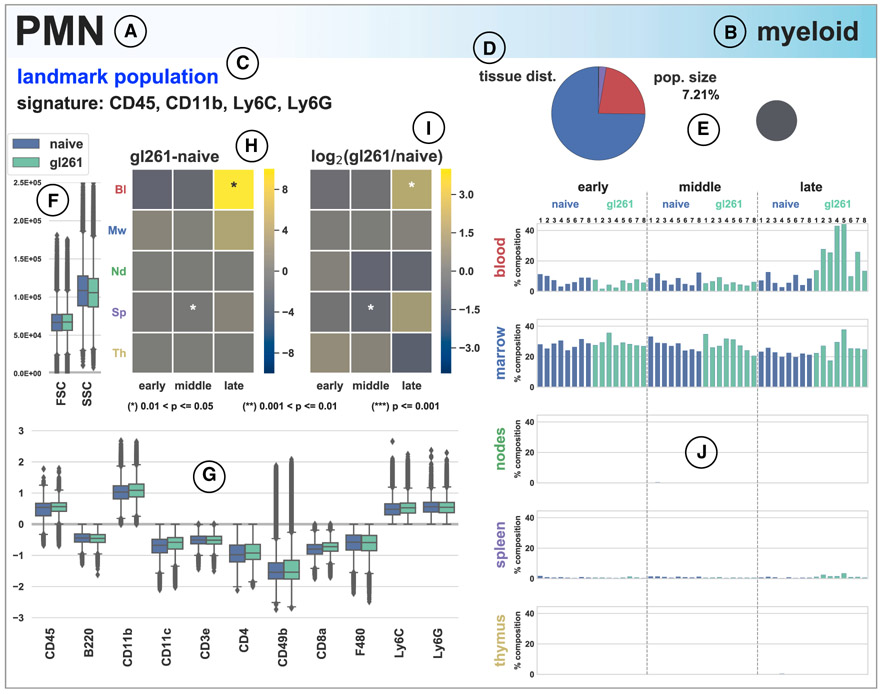
Figure 2. SYLARAS Dashboard Summarizing a GBM-Induced Immune System Perturbation.
(A–C) Example SYLARAS dashboard for polymorphonuclear (PMN) immune cells displaying 9 cell-type-specific attributes: (A) brief alias, (B) lineage, and (C) immunomarker signature indicating whether the immunophenotype corresponds to 1 of 14 major “landmark populations” (see text for details).
(D) Distribution of cells across 5 lymphoid tissues color-coded as in (H), (I), and (J).
(E) Percentage of this cell type relative to all immune cells (in the random sample subjected to detailed analysis).
(F) Forward and side scatter (FSC/SSC).
(G) Logicle-transformed, background-subtracted immunomarker signal intensity.
(H) Time and tissue-specific difference in mean cell frequency (percentage) between GBM-burdened and mock-engrafted animals; asterisks denote one of three levels of statistical significance as indicated (FDR-corrected, two-tailed independent Student’s t tests, n = 8 mice/group).
(I) Time and tissue-specific log2 fold-change in mean cell frequency (percentage) between GBM-burdened and mock-engrafted animals; asterisks are as in (H). (J) Percentage of each lymphoid tissue composed of PMN cells across the study’s 48 mice. See also Figure S4.

