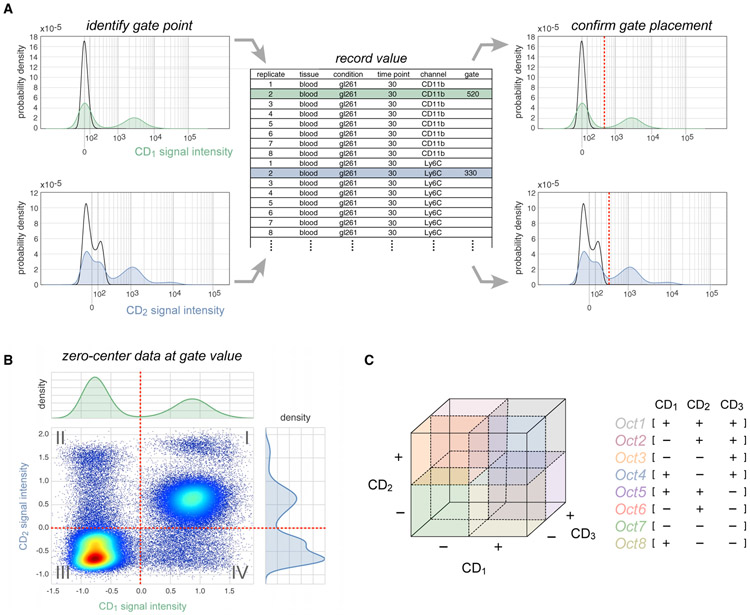
Figure 3. The SYLARAS Approach to Immune Cell Subset Identification.
(A) Illustration of an iterative procedure in which intensity versus cell number histograms were gated to distinguish positive staining from background autofluorescence. Example histograms are shown (CD1, green; CD2, blue). Black outlines superimposed on each histogram represent the signal intensity distribution of unlabeled (control) splenocytes which SYLARAS uses as a fiducial reference for background signal intensities. Gate values were entered into a .txt (or .xls) file preformatted with sample metadata and used to update the histograms with a vertical line (dashed red line) at the curated gate for review and further refinement if needed.
(B) Bivariate scatter plot showing the same signal intensity data as shown in (A) following Logicle-transformation and subtraction of respective gate values from cell signal intensities. The two-way intensity distribution demonstrates the binning of cells among 22 = 4 possible immunophenotype quadrants.
(C) Extension of quadrant gating for two-dimensional data to octant gating for three-dimensional data where cells are binned among 23 = 8 possible immunophenotype octants. This procedure is extended to the total number of antibody markers in the data.

