Figure 3.
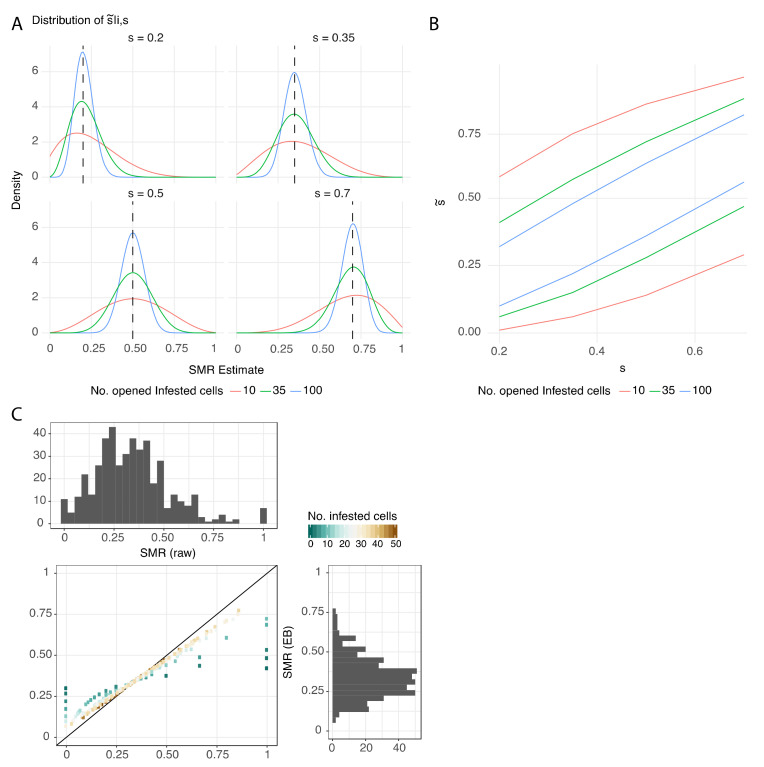
SMR estimates reliability. (A) Density of distribution of the SMR estimate, depending on the SMR value (s = 0.2, 0.35, 0.5 or 0.7) and the number of opened single-infested cells (SIC, no. of SIC = 10, 35, or 100). (B) Precision of the SMR estimate (95% quantiles), depending on the SMR estimate. Three examples of SIC numbers are represented (10, 35, and 100) to illustrate the fact that using 10 SIC does not give a reliable SMR estimate. (C) “Empirical Bayes” (EB) distribution with the initial distribution of raw SMR values (top) and comparison to the EB estimates. The distance to the identical distribution (black line) is acceptable when the number of SIC is greater than 30 (pale brown).

