
Figure 7.
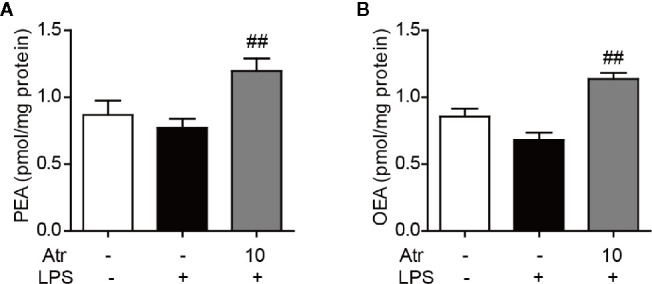
Effects of atractylodin on fatty acid ethanolamide levels in LPS-induced BV-2 cells. (A) PEA and (B) OEA levels were measured by LC-MS/MS. Data are expressed mean ± SEM. ##P<0.01 compared with the LPS vehicle group.
Official websites use .gov
A
.gov website belongs to an official
government organization in the United States.
Secure .gov websites use HTTPS
A lock (
) or https:// means you've safely
connected to the .gov website. Share sensitive
information only on official, secure websites.
Effects of atractylodin on fatty acid ethanolamide levels in LPS-induced BV-2 cells. (A) PEA and (B) OEA levels were measured by LC-MS/MS. Data are expressed mean ± SEM. ##P<0.01 compared with the LPS vehicle group.