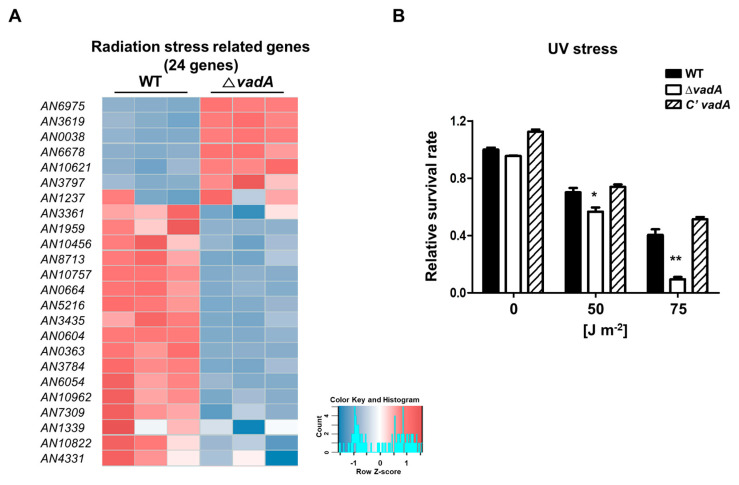
Figure 4.
Role of vadA in the UV-mediated stress response. (A) Heat map showing the DEGs with UV stress response. (B) The tolerance of control (THS30), ΔvadA (THS33), and C’ vadA (THS34) conidia against UV irradiation. About 102 conidia were irradiated with 50 or 75 J/m2 of UV at 260 nm (triplicate measurements). Error bars represent the standard deviation (differences between the vadA mutants and control strains). ** p < 0.01; * p < 0.05.

