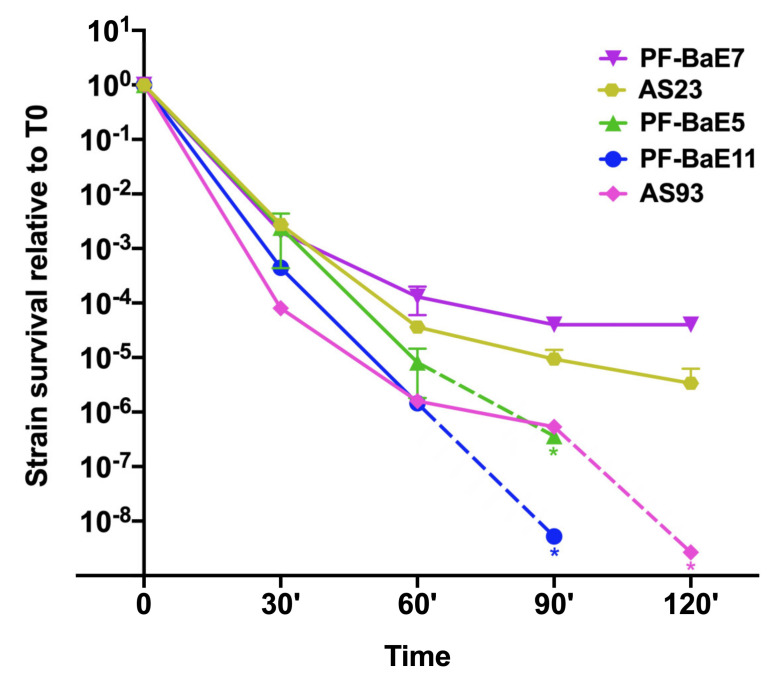
Figure 3.
Relative survival of selected strains to the simulated gastric fluid over 2 h. Results are expressed as the ratio of the CFU/mL at a given time point to the CFU/mL at time zero ± SEM with a semi-logarithmic scale. * indicates a default value corresponding to a number of CFU/mL below 100 (as the CFU/mL at T0 was slightly different among strains, the default values differ). Dotted lines are joining the last CFU measures and default values.

