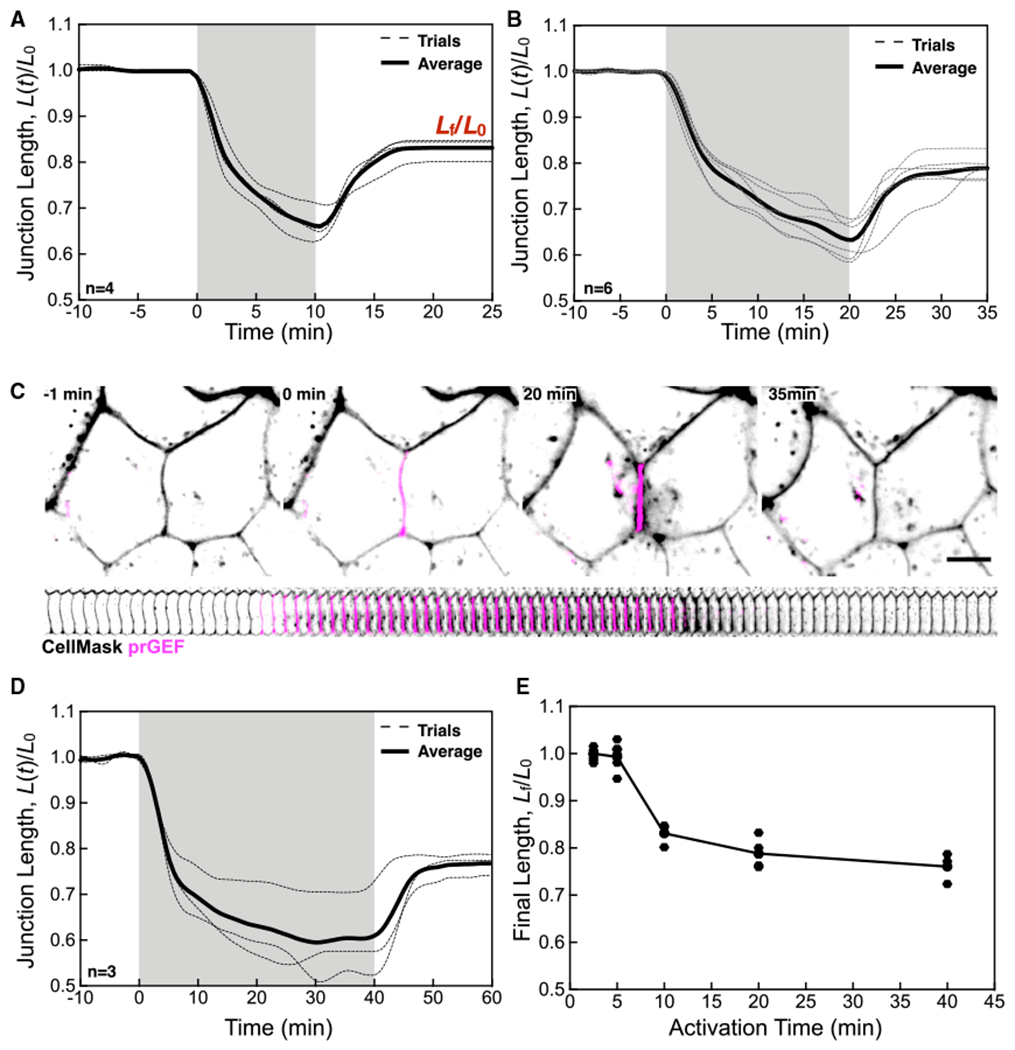
Figure 2. Contraction Saturates at Longer Timescales to Limit Junction Length Changes.

(A) Normalized junction length over time for a 10-min activation.
(B) Normalized junction length over time for a 20-min activation.
(C) Representative image of a junction in a 20-min activation. Red lines denote positions and lengths between the two junction vertices. Scale bar, 10 μm.
(D) Normalized junction length over time for a 40-min activation. (E) The fractional final junction length, Lf/L0 as a function of the activation time. Data for individual junctions are shown, with the line as a guide for the eye.
For (A), (B), and (C) the individual traces for n junctions are shown (dashed lines) as well as the average (solid line).
