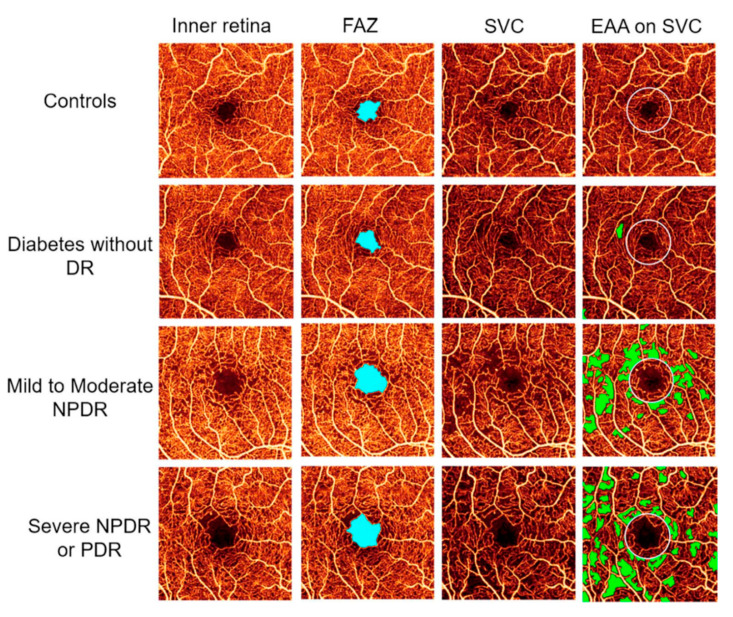
Figure 2.
Optical coherence tomography angiography of the inner central retina in healthy subjects and in patients with diabetic retinopathy of different severities (first column). Second column shows the foveal avascular zone (FAZ, light blue), third column the superficial vascular layer (SVC), and the fourth column the extrafoveal avascular area (EAA, green) on the SVC. From [45] with permission.

