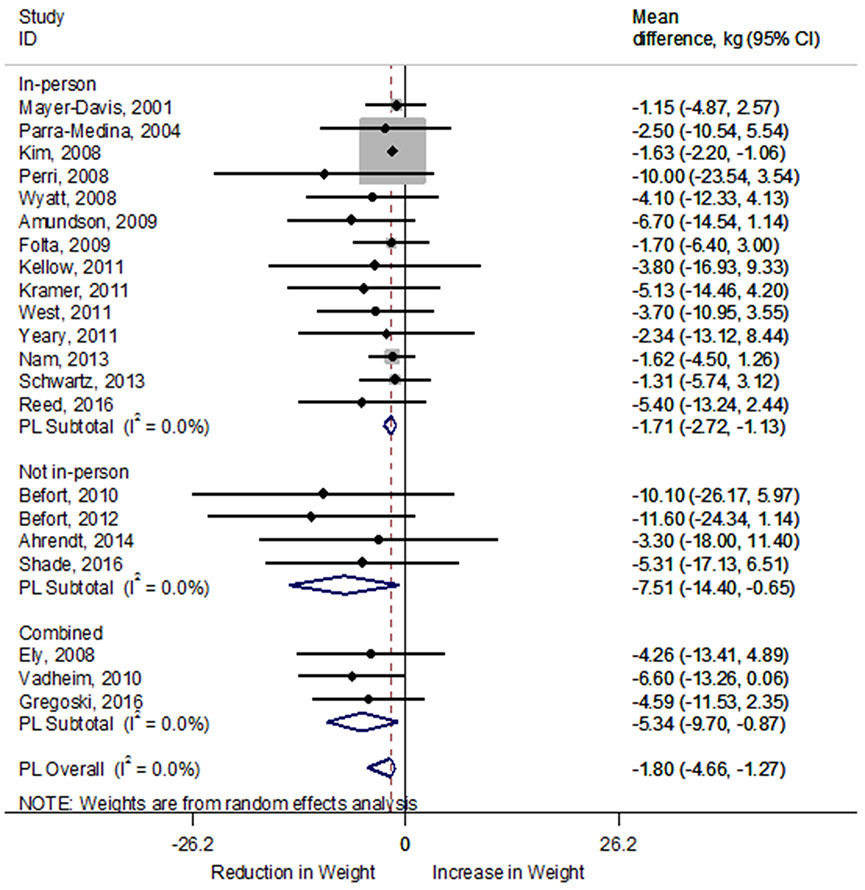
Figure 3.
Forest plot of random-effects meta-analysis of mean difference (kg) in weight loss between pre- and post-intervention by intervention type. A rhombus represents the combined effects estimate. Mean difference (circle) and 95% confidence intervals (whiskers) are presented for individual interventions. The size of the grey box is proportional to the weight assigned to each intervention. DL, DerSimonian-Laird; Kg, kilogram.

