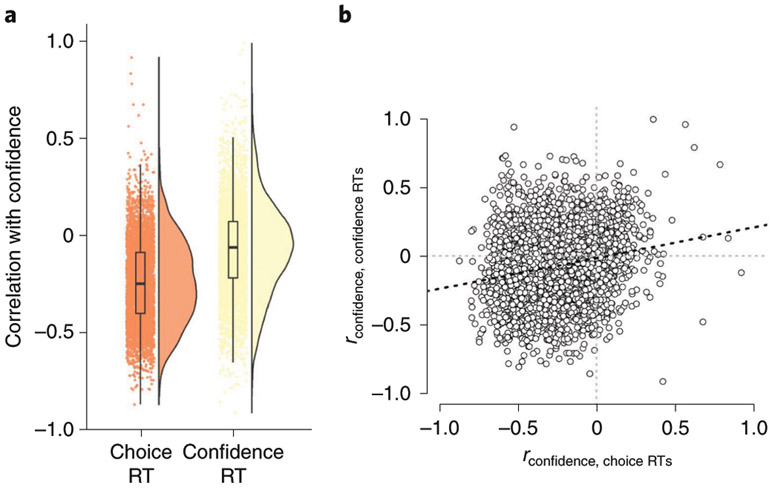
Figure 2. Correlating confidence with choice and confidence RT.
(A) We found a medium-to-large negative correlation (r = −.24, p < 2.2e-16, n = 4,089) between confidence and choice RT, as well as a small negative correlation (r = −.07, p < 2.2e-16, n = 4,089) between confidence and confidence RT. Box shows the median and the interquartile (25-75%) range, whereas the whiskers show the 2-98% range. (B) The strength of the two correlations in panel A were themselves correlated across subjects (r = .23, p < 2.2e-16, n = 4,089).

