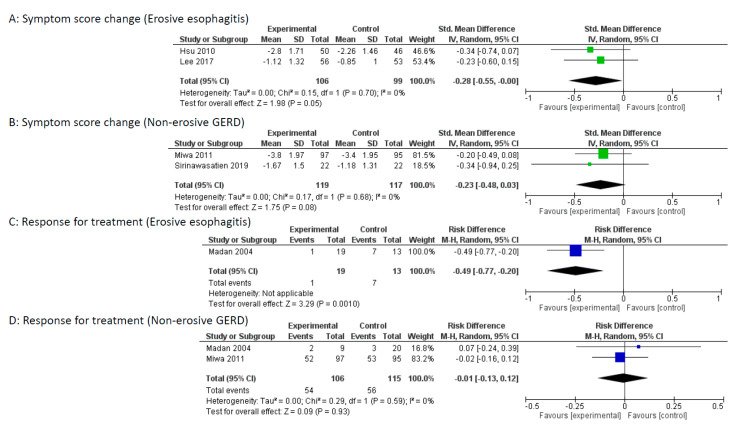
Figure 5.
Subgroup analysis between non-erosive gastroesophageal reflux disease (GERD) and erosive esophagitis. (A) Forest plot of the standardized mean difference (SMD) with 95% confidence intervals (CI) of symptom score change for mosapride combined with PPI versus PPI alone for erosive esophagitis. (B): Forest plot of the SMD with 95% CI of symptom score change for mosapride combined with PPI versus PPI alone for non-erosive GERD. (C): Forest plot of the risk difference (RD) with 95% CI of response rate for mosapride combined with PPI versus PPI alone for erosive esophagitis. Events represent treatment failure. (D): Forest plot of the RD with 95% CI of response rate for mosapride combined with PPI versus PPI alone for non-erosive GERD. Events represent treatment failure.

