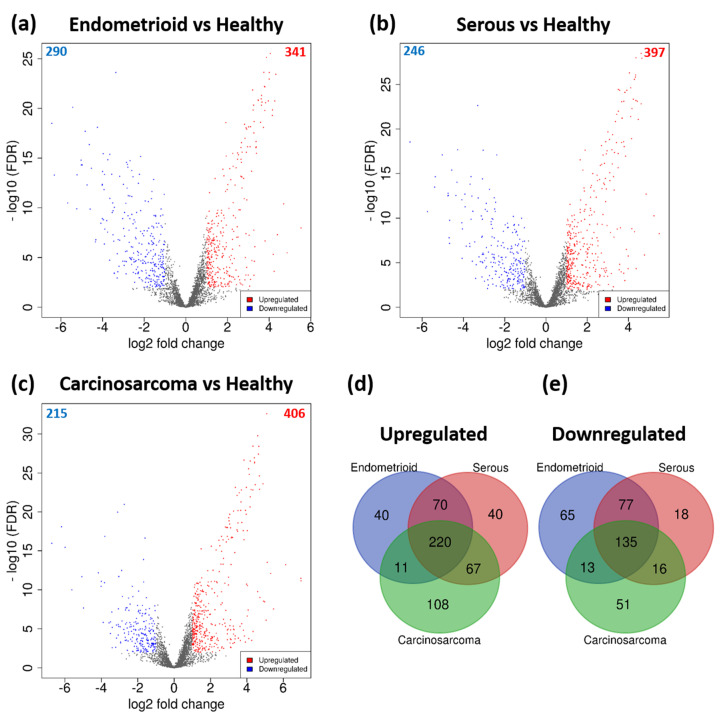
Figure 4.
Volcano plots of DEGs between (a) endometrioid and healthy endometrium, (b) serous and healthy, and (c) carcinosarcoma and healthy. Significant DEGs are coloured; red dots represent upregulated genes, and blue dots represent downregulated genes. Cut-off criteria: │log2FC > 1│and FDR < 0.01. Venn diagrams displaying common (d) upregulated and (e) downregulated genes between each subtype.

