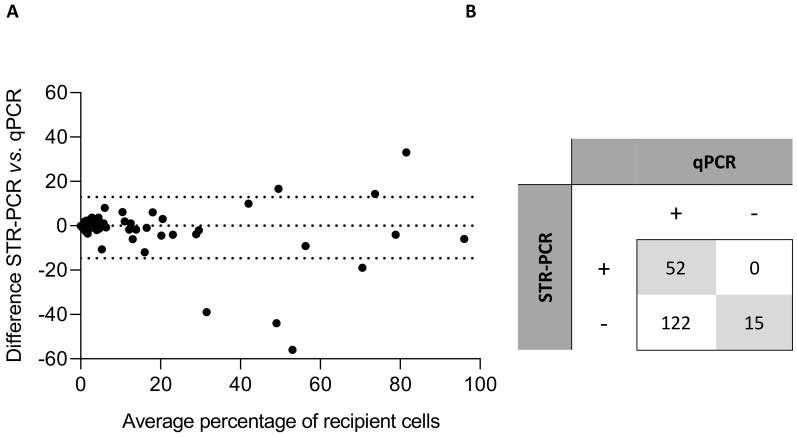
Figure 1.
Correlation analysis. (A) Bland and Altman representation of the results of chimerism quantification with both techniques in 171 patient samples and 18 artificial mixtures. (B) Number of positive (presence of recipient DNA, MC) and negative (absence of recipient DNA, CC) samples with each technique. A segregated comparison of the results obtained in BM and PB samples is provided in Supplementary Table S2.

