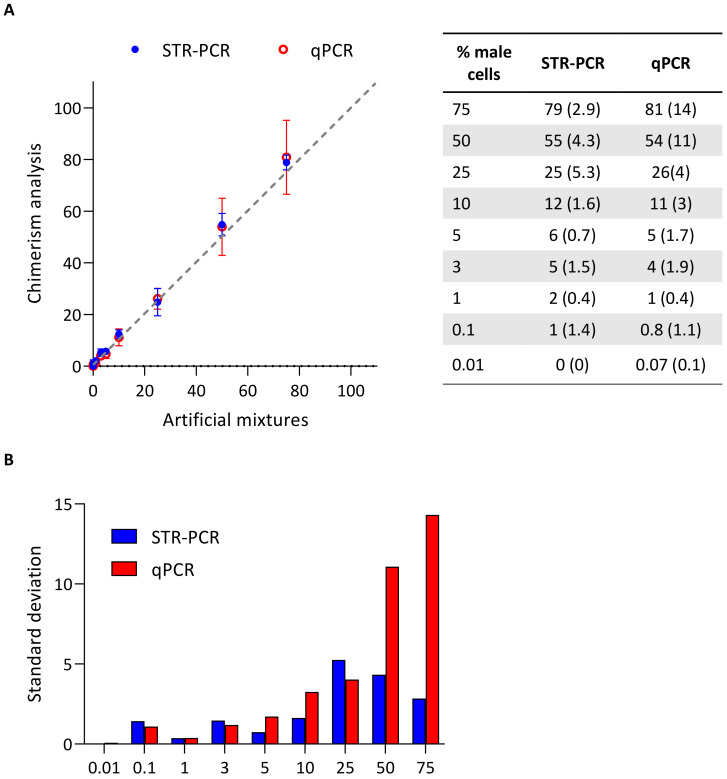
Figure 2.
Artificial mixture analysis. (A) Results of chimerism quantification using STR-PCR (blue) and qPCR (red), versus actual percentage of cells of putative recipient (male). Results are represented as mean and standard deviation (SD, in brackets) of different independent experiments (n = 2 for STR-PCR, and n = 3 for qPCR). A representation using a logarithmic scale in the x and y axes is provided in Supplementary Figure S1, in order to better discriminate differences in values below 10%, which are clinically less significant. (B) Standard deviation of both techniques by percentage of recipient cells.

