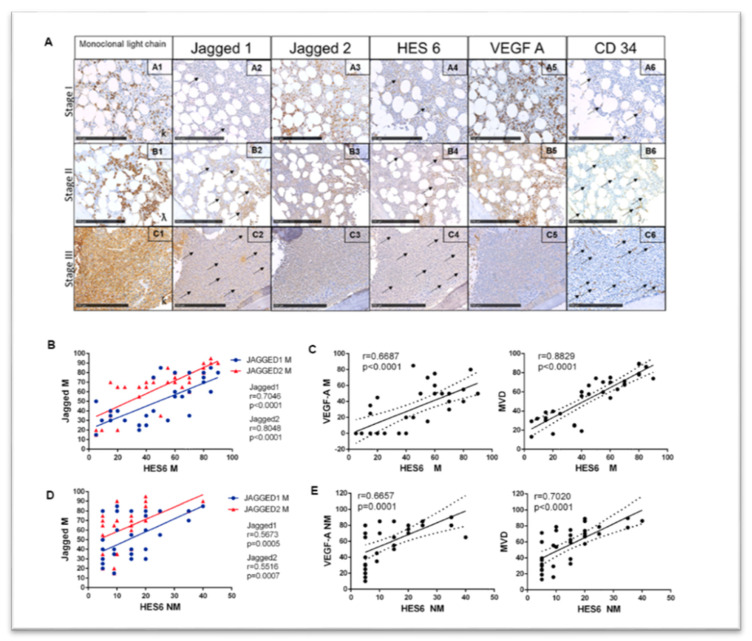
Figure 5.
Correlation analysis of the Jagged ligands, Notch activation and angiogenesis in MM patients’ BMBs. (A) representative images of the antigen immunoreactivity for the monoclonal Ig light chain, Jagged1, Jagged2, HES6, VEGF-A and CD34 in BMBs from 34 MM patients at different degrees of tumor infiltration (I: less than 20%; II: 21–50%; III: >51%). The arrows indicate specific immunoreactive signals. Photos were acquired at Nano-Zoomer 2.0 and scale bar is for 250 µm. Pearson’s correlation coefficient (r) and the p-values are reported for the correlation analyses between (B) Jagged1 and Jagged 2 expressed in MM cells and the Notch transcriptional target HES6 in the same tumor cells; (C) HES6 and VEGF-A expressed in MM cells or MVD; (D) Jagged1 and Jagged 2 expressed in MM cells and the Notch transcriptional target HES6 in nearby non-tumor cells; and (E) HES6 in non-tumor cells and VEGF-A in non-tumor cells and MVD. M = MM cells; NM = non tumor cells. Statistical analysis was carried out using two-tailed t-tests.

