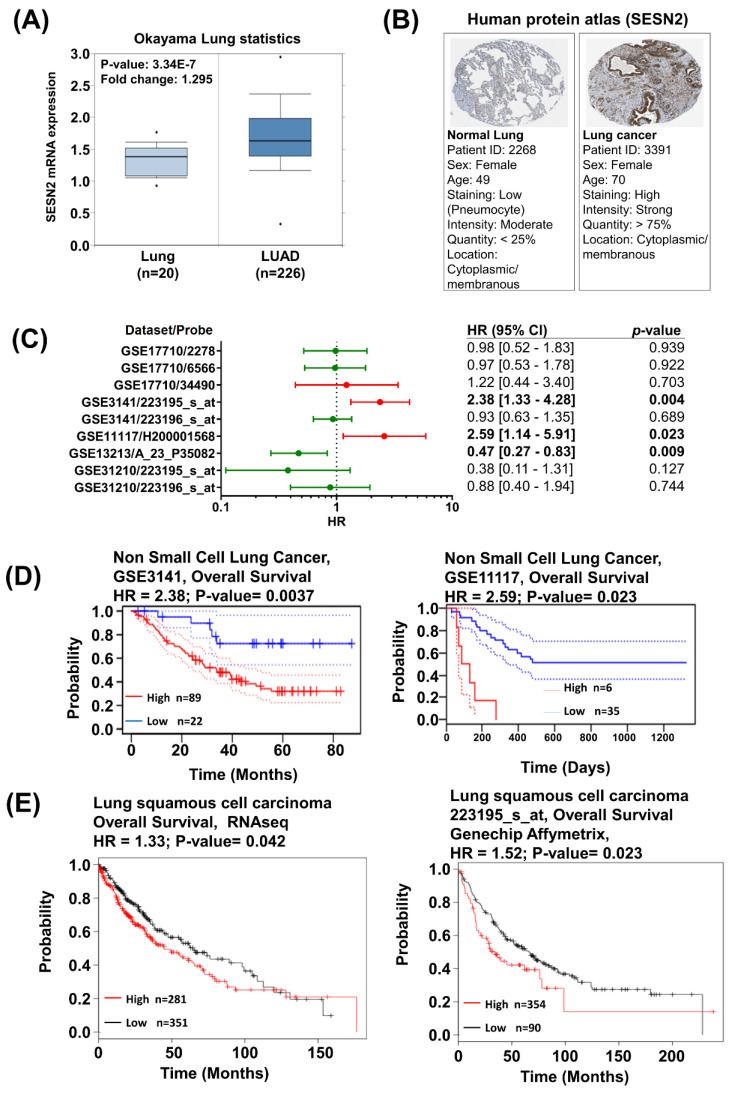
Figure 4.
Sestrin2 mRNA expression analysis in lung cancer patients using various bioinformatic databases. (A) Oncomine database analysis of Okayama Lung statistics comparing Sestrin2 mRNA expression in normal lung with that in lung cancer. (B) Human Protein Atlas analysis for patient tissue staining. The normal lung tissue is stained with a low amount of Sestrin2 antibody (patient ID = 2268) while the lung cancer tissue is stained with a high amount of Sestrin2 antibody (patient ID = 3391) (C) Forest plots of GEO datasets evaluating association of sestrin2 expression and overall survival in lung cancer datasets in Prognoscan database. Hazard ratio (HR) with 95% confidential interval (CI) and p-values are labeled in the right column of each forest plot. (D) The survival rate graph compares high (red) and low (blue) Sestrin2 expression in non-small cell lung cancer patients. Prognoscan database analysis survival curve plotter using GSE3141–overall survival (hazard ratio = 2.38, p-value = 0.0037) (high n = 89, low n = 22) and GSE11117–overall survival (hazard ratio = 2.59, p-value = 0.023) (high n = 6, low n = 35) datasets. (E) The survival rate graph compares high (red) and low (black) Sestrin2 expression in lung squamous cell carcinoma patients. The 223195_s_at dataset was analyzed with RNAseq and Affymetrix Genechip using KM plotter.

