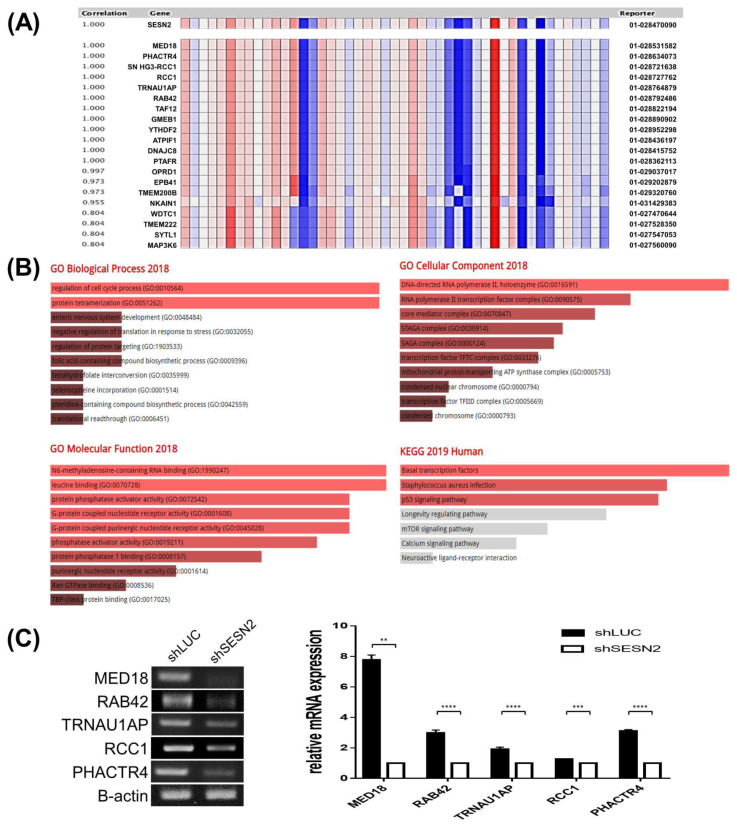
Figure 6.
Sestrin2 co-expression gene analysis using RT-PCR (A) Co-expression gene analysis in the Bass lung dataset using the Oncomine database. (B) GO and KEGG analysis with Sestrin2 and co-expressed genes using Enrichr; bar graph listed by p-value. The brighter the bar color, the more significant the related pathway. (C) The expression of top 5 co-expression genes was downregulated in Sestrin2 knockdown A549 cell as shown by RT-PCR. Fold-change was measured by ImageJ; graph shown to the right. (** p < 0.01; *** p < 0.005; **** p < 0.0001).

