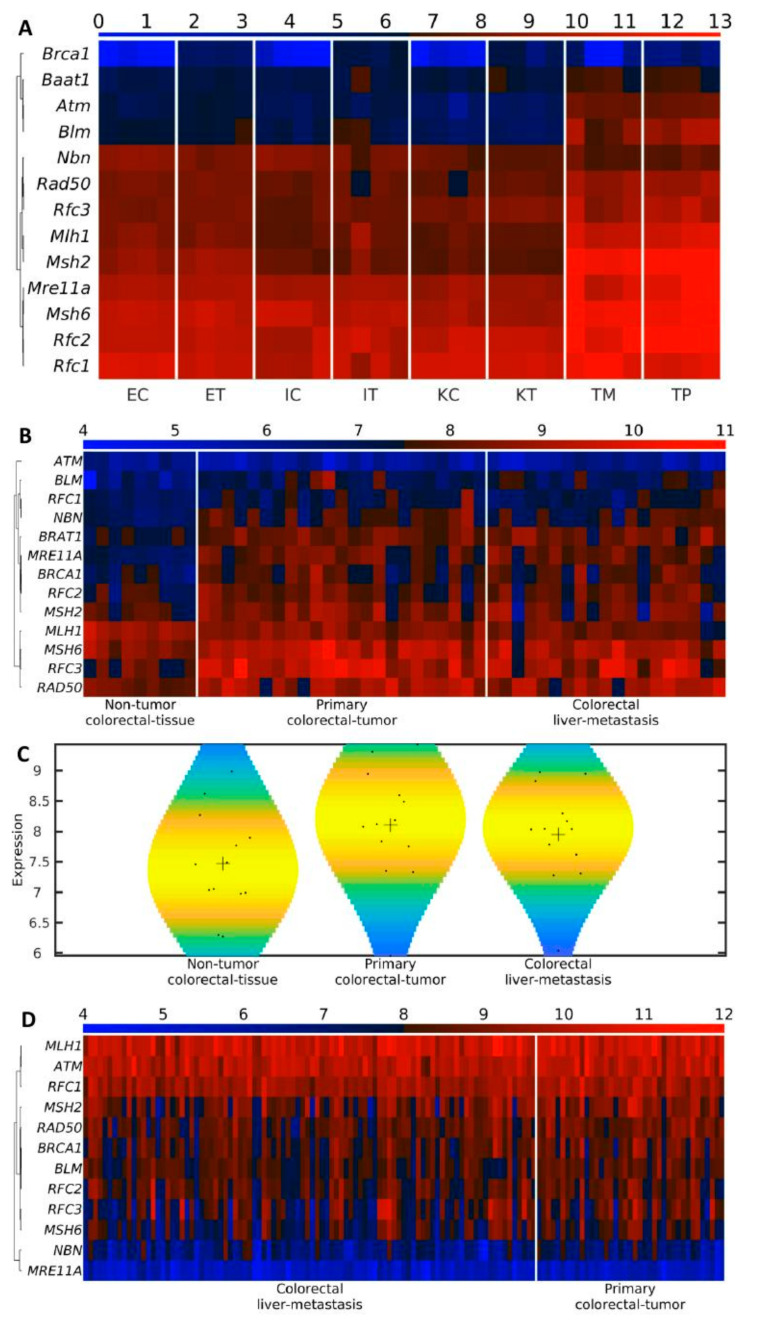
Figure 6.
BRCA1 is the last BASC gene activated in TME. Heatmap of the expression of BASC-related genes in (A) mouse liver cell samples. The samples are denoted with E, I, and K for endothelial, Ito, and Kupffer cells, C and T for control and TME cells, and TP and TM denote the CRC primary and tumor liver metastasis cells, respectively. Higher gene expression corresponds to a redder color (for each mRNA sample, we used 4 biological replicates); and (B) human non-tumor colorectal tissue, primary colorectal tumor, and colorectal liver metastasis from 51 patients [39]. Higher gene expression corresponds to a redder color. (C) Violin plot of the expression distribution of human BASC-related genes. Black crosses represent mean positions. Black points represent the spread of the expression of the genes used to build the distributions. (D) Heatmap of the expression of BASC-related genes in human primary colorectal tumor and colorectal liver metastasis from 133 patients [40]. Higher gene expression corresponds to a redder color.

