Figure 2.
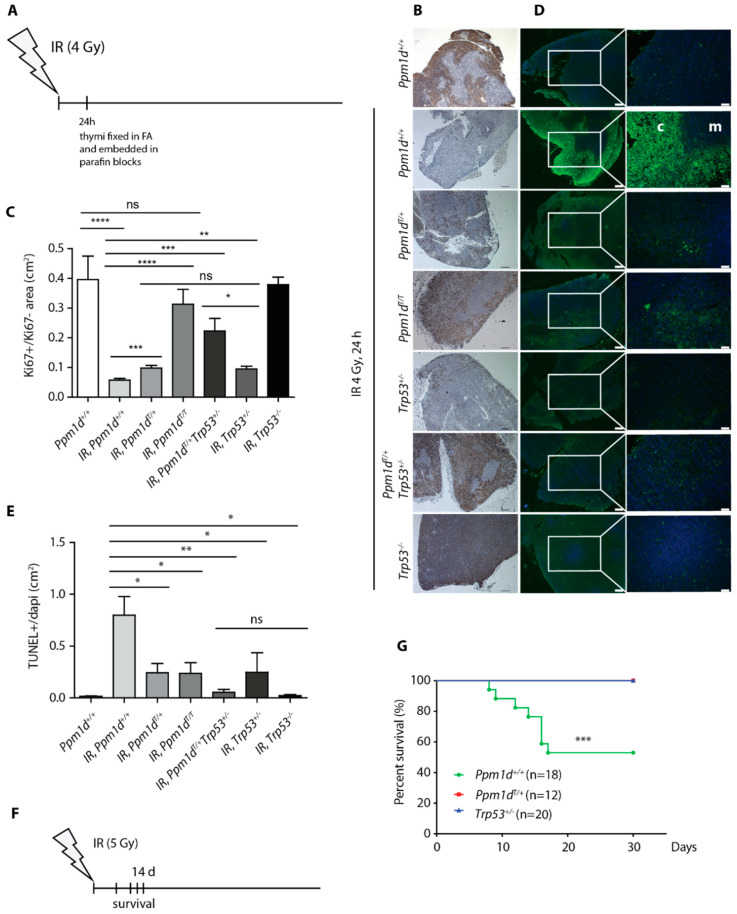
Truncated PPM1D prevents apoptosis and promotes proliferation after genotoxic stress. A scheme of the experimental setup of B–E. Thymi were collected from mice sacrificed 24 h after exposure to mock or to IR (4 Gy) and analyzed by immunohistochemistry (A). Histology sections of thymi from mice of indicated genotypes exposed to mock or to IR (4 Gy) were probed with antibody against Ki-67 (proliferation marker). Representative images are shown. Magnification 5×, bars indicate 200 μm (B). Quantification of Ki-67 signal from B. At least 3 sections from 3 mice per genotype were quantified. Error bars indicate SD. Statistical significance was evaluated by two-tailed t-test, * p < 0.05; ** p < 0.01; *** p < 0.0005; **** p < 0.0001. (C). Histology sections of thymi from mice of indicated genotypes exposed to mock or to IR were subjected to TUNEL assay (apoptosis marker). Note high TUNEL+ signal in cortex (c) but not in medulla (m) of the Ppm1d+/+Trp53+/+ mice. Representative images are shown. Magnification 5× and 20×, bars indicate 200 μm and 50 μm, respectively (D). Quantification of TUNEL+ signal from D. At least 3 sections from 3 mice per genotype were quantified. Error bars indicate SD. Statistical significance was evaluated by two-tailed t-test, * p < 0.05; ** p < 0.01 (E). A scheme of the experimental setup in G (F). Wild-type Ppm1d+/+Trp53+/+, Ppm1dT/+Trp53+/+, and Ppm1d+/+Trp53+/− mice were exposed to 5 Gy of IR and their survival was monitored for subsequent 30 days. n values indicate the numbers of animals of each genotype. Statistical significance of the Kaplan-Meier survival plot was determined by a log-rank test, **** p < 0.005 (G).

