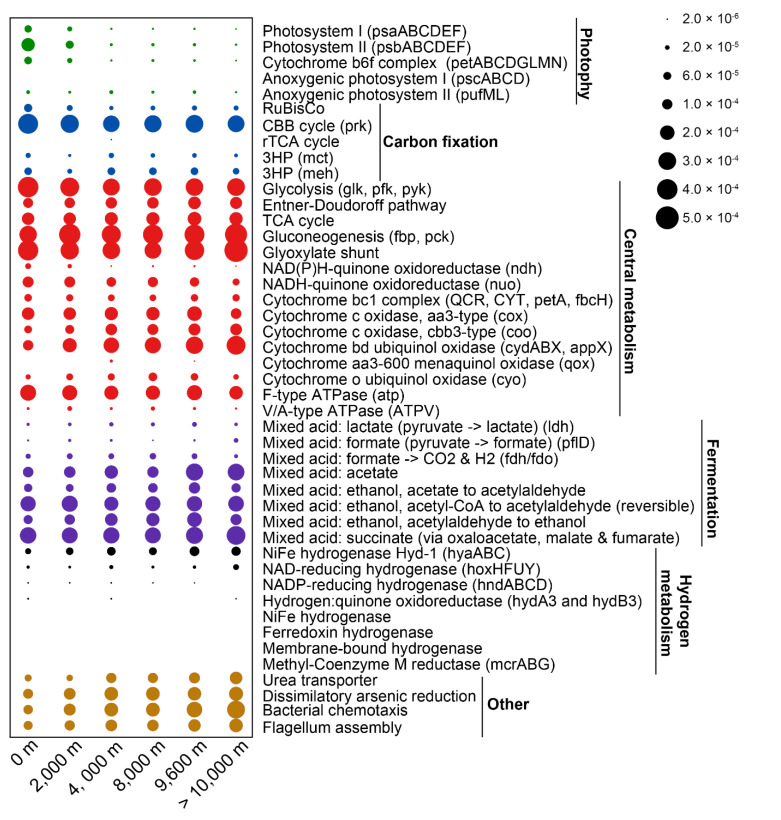
Figure 2.
Distribution of major functional processes across different water depths in the Mariana Trench. The X-axis indicates the different water layer samples were derived from. The y-axis indicates the major selected functional processes involved in oxidative phosphorylation, carbon fixation, carbon degradation, hydrogen redox and other specific pathways. Distribution of these functional processes in each sample can be found in Figure S3.

