Figure 4.
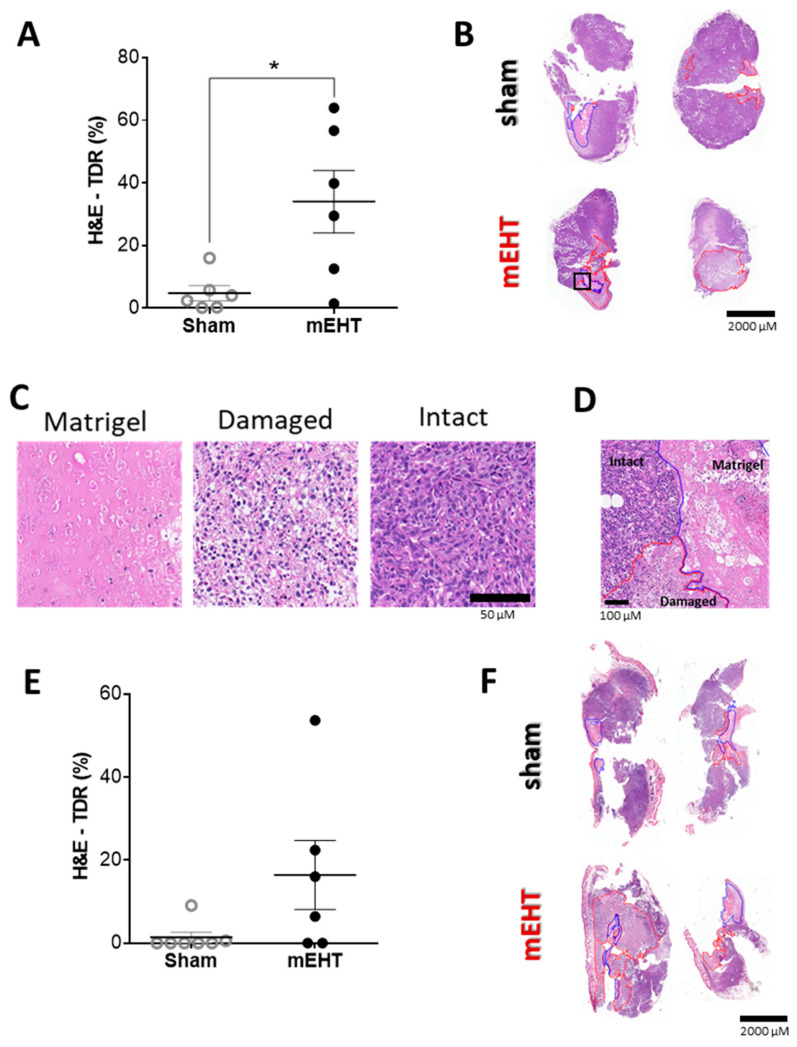
mEHT-induced tumor destruction. (A,B) Tumor destruction 24 h after two mEHT treatments. (A) Tumor destruction ratio (TDR) evaluated on hematoxylin-eosin (H&E) stained sections; (B) Apoptotic areas (red contour) and Matrigel® (blue contour) on representative H&E stained sections; (C) Matrigel® and damaged tumor areas on H&E stained sections (Magnification: 36×); (D) representative image of intact vs. damaged area and Matrigel® (magnified from the H&E section: B/black rectangle, magnification: 8.5×); (E,F) Tumor destruction 24 h after one mEHT treatment; (E) TDR evaluated on H&E stainings; (F) Apoptotic areas (red contour) and Matrigel (blue contour) on representative H&E stained sections. Mean ± SEM, Mann–Whitney test, n = 6/group, * p = 0.0174.

