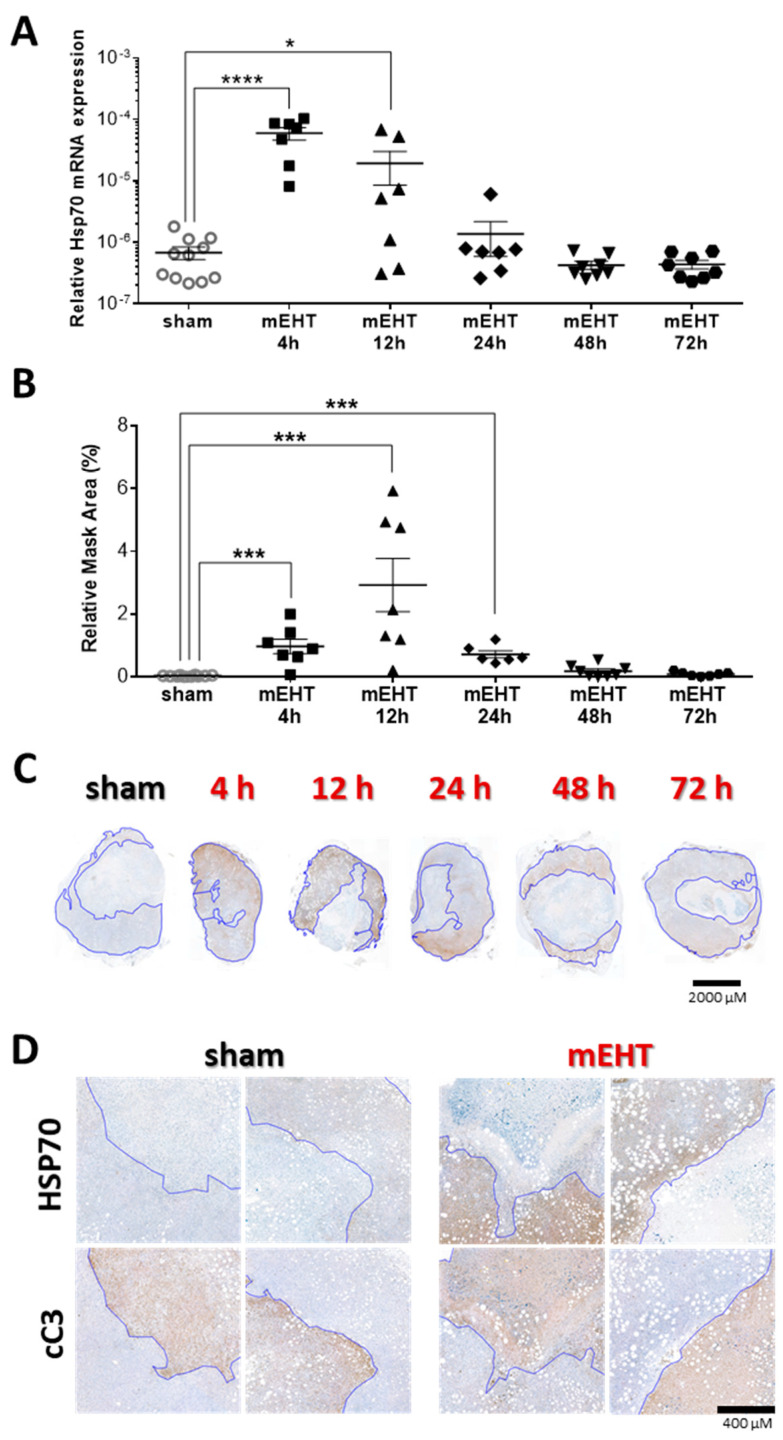
Figure 8.
Time kinetics of Hsp70 expression after three mEHT treatments. (A) Hsp70 mRNA expression of the tumors at different time-points after treatment; (B) Area-proportional expression of Hsp70 protein at different time points after treatment; (C) Representative tumor images from the sham and mEHT groups; (D) High-magnification images of cC3 and Hsp70 stainings from sham and mEHT treated tumors. Blue line marks the border between live and damaged tumor area assigned based on the cC3-stainings, (Magnification: 5×); (A,B) sham vs. mEHT, unpaired Mann–Whitney test. Mean ± SEM, * p = 0.03, *** p < 0.001, **** p < 0.0001.

