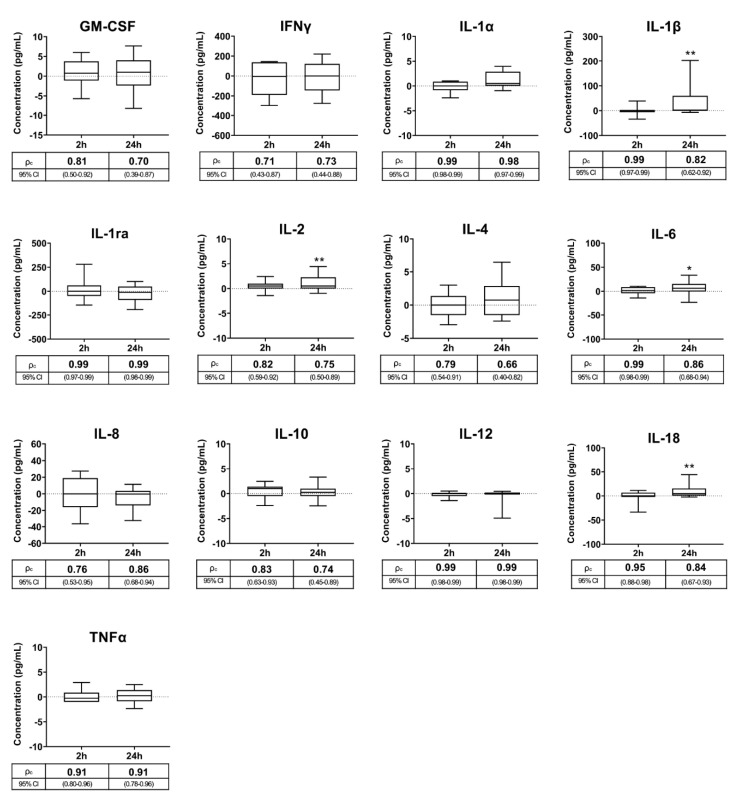
Figure 1.
Box-and-whisker plot (horizontal line: median; box: 25/75 percentile; whisker: 10/90 percentile) showing the differences in cytokine concentrations measured in pig seminal plasma samples (SP) harvested 2 h and 24 h after ejaculate collection with respect to those harvested immediately after ejaculation (baseline samples, point 0 on Y axis). Below the X-axis is the concordance correlation coefficient (ρc) and 95% confidence interval (CI) showing agreement between the cytokine concentrations of the baseline and the experimental SP samples. Cytokines: Granulocyte macrophage colony-stimulating factor (GM-CSF), interferon-gamma (IFNγ), interleukin (IL)-1α, IL-1β, IL-1ra, IL-2, IL-4, IL-6, IL-8, IL-10, IL-12, IL-18 and tumor necrosis factor-α (TNFα). Asterisks indicate statistical differences with baseline data. ** p < 0.01; * p < 0.05.

