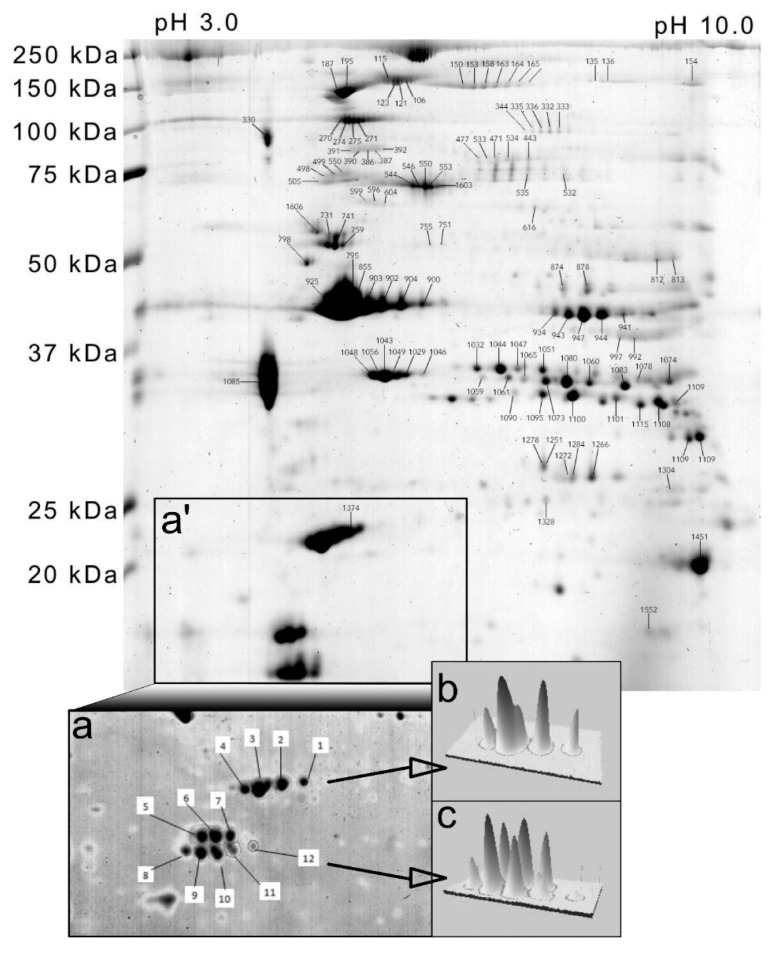
Figure 4.
Analysis of myofibrillar proteoforms by two-dimensional gel electrophoresis. Gel map of human myofibrillar proteins annotated with spot numbers that correspond to protein identities in Table 1 and Table 2. Subpanels illustrate the region of interest (a’) and higher-resolution separation of region (a’) by narrow-range (pH 4–7) isoelectric focusing (a) to resolve myosin light chain isoforms. Panels (b,c) illustrate three-dimensional representations of essential myosin light chains (MyLC1/3) and regulatory myosin light chains MLRV and MLRS spots, respectively.

