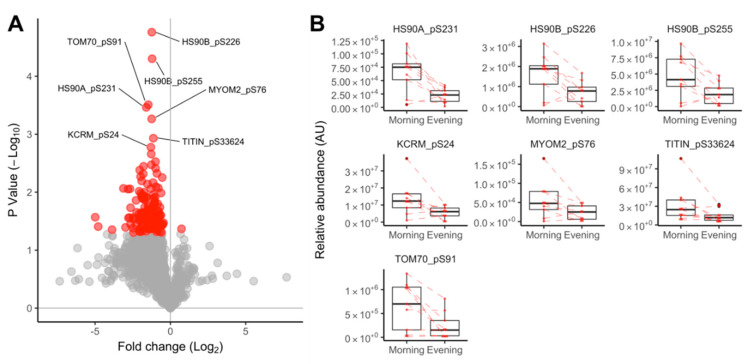
Figure 5.
Diurnal differences in muscle protein phosphorylation. Volcano plot (A) presenting the log2 fold change in phosphopeptide abundance between evening and morning conditions and the statistical significance determined by within-subject ANOVA (n = 9 participants). Phosphopeptides that were statistically different (p < 0.05) and had a false discovery rate <10% are annotated with their unique UniProt identifier and phosphorylation site; phosphopeptide-specific data (B) illustrating within-subject data connected by dashed lines and group data (median, quartile ranges) summarized by ‘box and whisker’ plots for the statistically significant (p < 0.05, FDR < 10%) phosphopeptides.

